After creating a new dashboard the filters and favorites are not displaying on the left side.

The version info is as follows:

Cache for Windows (x86-64) 2017.2.1 (Build 801_3_18358U) Tue Jul 24 2018 16:38:29 EDT [HealthShare Modules:Core:15.032.8680 + Linkage Engine:15.032.8680 + Clinical Viewer:15.032.8680 + Active Analytics:15.032.8680

Thanks,

LG

0 3
0 150

Hi,
I cannot edit properties (title etc) of Widgets within Dashboards outside of the ENSDEMO namespace:
I have a namespace "HL7Report" for example;
I have some Pivots created looking into a cube's data;
I click "DeepSee", "User Portal" from the Management Portal;
I click "+", "Add Dashboard", folder/name/title/category all as "new", "OK", new dashboard appears;
I click ">", "Widgets >", "+", and select a pivot to display as a table (chart / anything);

0 3
0 315
Question
· Jul 24, 2020
Uptime reports for Ensemble HL7

Good morning all,

Could we please get some insight on what is possible (or what other organizations may be using) for tracking uptime for our HL7 engine? We can use Activity Tracking to show how many messages went through, but are there any good canned reports (or queries) about the number of message failures or the amount of time that an interface was down?

We are using alerting to the team to know about not getting messages or if messages failed. Has anyone created a report or dashboard against the Ens.Alert table or would you recommend elsewhere?

0 3
0 230
Question
· Nov 10, 2015
Dashboard Branding...

Hello DeepSee'ers -

How hard is it to brand a dashboard to a login?

The situation is, I have a Partner that is looking to create common Dashboards in a SaaS model where the Partner's Clients would want to have their individual views of this common dashbaord be branded (logos, color, styles, etc.) to match the Client's branding. This my Partner's Client's End Users will see this common dashboard as the dashboard from the "Client" and not the "Partner" (and certainly not ISC branding)

ie. ISC -> Partner -> Client -> End User

0 2
1 278

Hello there Intersystems Developer Community,

This year while at the Global Summit, I came to learn of a component that Stephen Morrison of Intersystems had written that was capable of infusing SVG content into a PDF document. Apparently Stephen was approached about this and was amenable to sharing the code with us as we have recently encountered a similar need. I'm hoping this post will lead to the sharing of this utility code, so that we can determine if it will indeed suit our need.

0 2
0 412

I need to pass multiple values to a FILTER to a DeepSee DASHBOARD via the URL. The documentation seems to indicate this can be done, i.e.: "Where each filterspec is filter_name.filter_values" but there are no examples I can find that indicates what is used to separate multiple values. Say I want to pass the three values 5, 6, and 1395 to a filter. To pass just the 5 I know this works:

&SETTINGS=FILTER:LEAD.MYUSERID.H1.MYUSERID.5

but how do I include 6 and 1395. None of the following seem to work:

&SETTINGS=FILTER:LEAD.MYUSERID.H1.MYUSERID.5.6.1395

1 2
0 371

I have a DeepSee KPI defined based on %DeepSee.KPI following the documentation http://docs.intersystems.com/latest/csp/docbook/DocBook.UI.Page.cls?KEY=.... I've then enabled the KPI on a dashboard by adding a Widget where the data source is the KPI. Currently the ability to show a Detail Listing is implemented by the call back %OnGetListingSQL. This method documents the parameter

1 2
0 306

I've asked a lot of questions leading up to this, so I wanted to share some of my progress.

The blue line represents the number of messages processed. The background color represents the average response time. You can see ticks for each hour (and bigger ticks for each day). Hovering over any point in the graph will show you the numbers for that period in time.

This is super useful for "at a glance" performance monitoring as well as establishing patterns in our utilization.

5 2
0 482

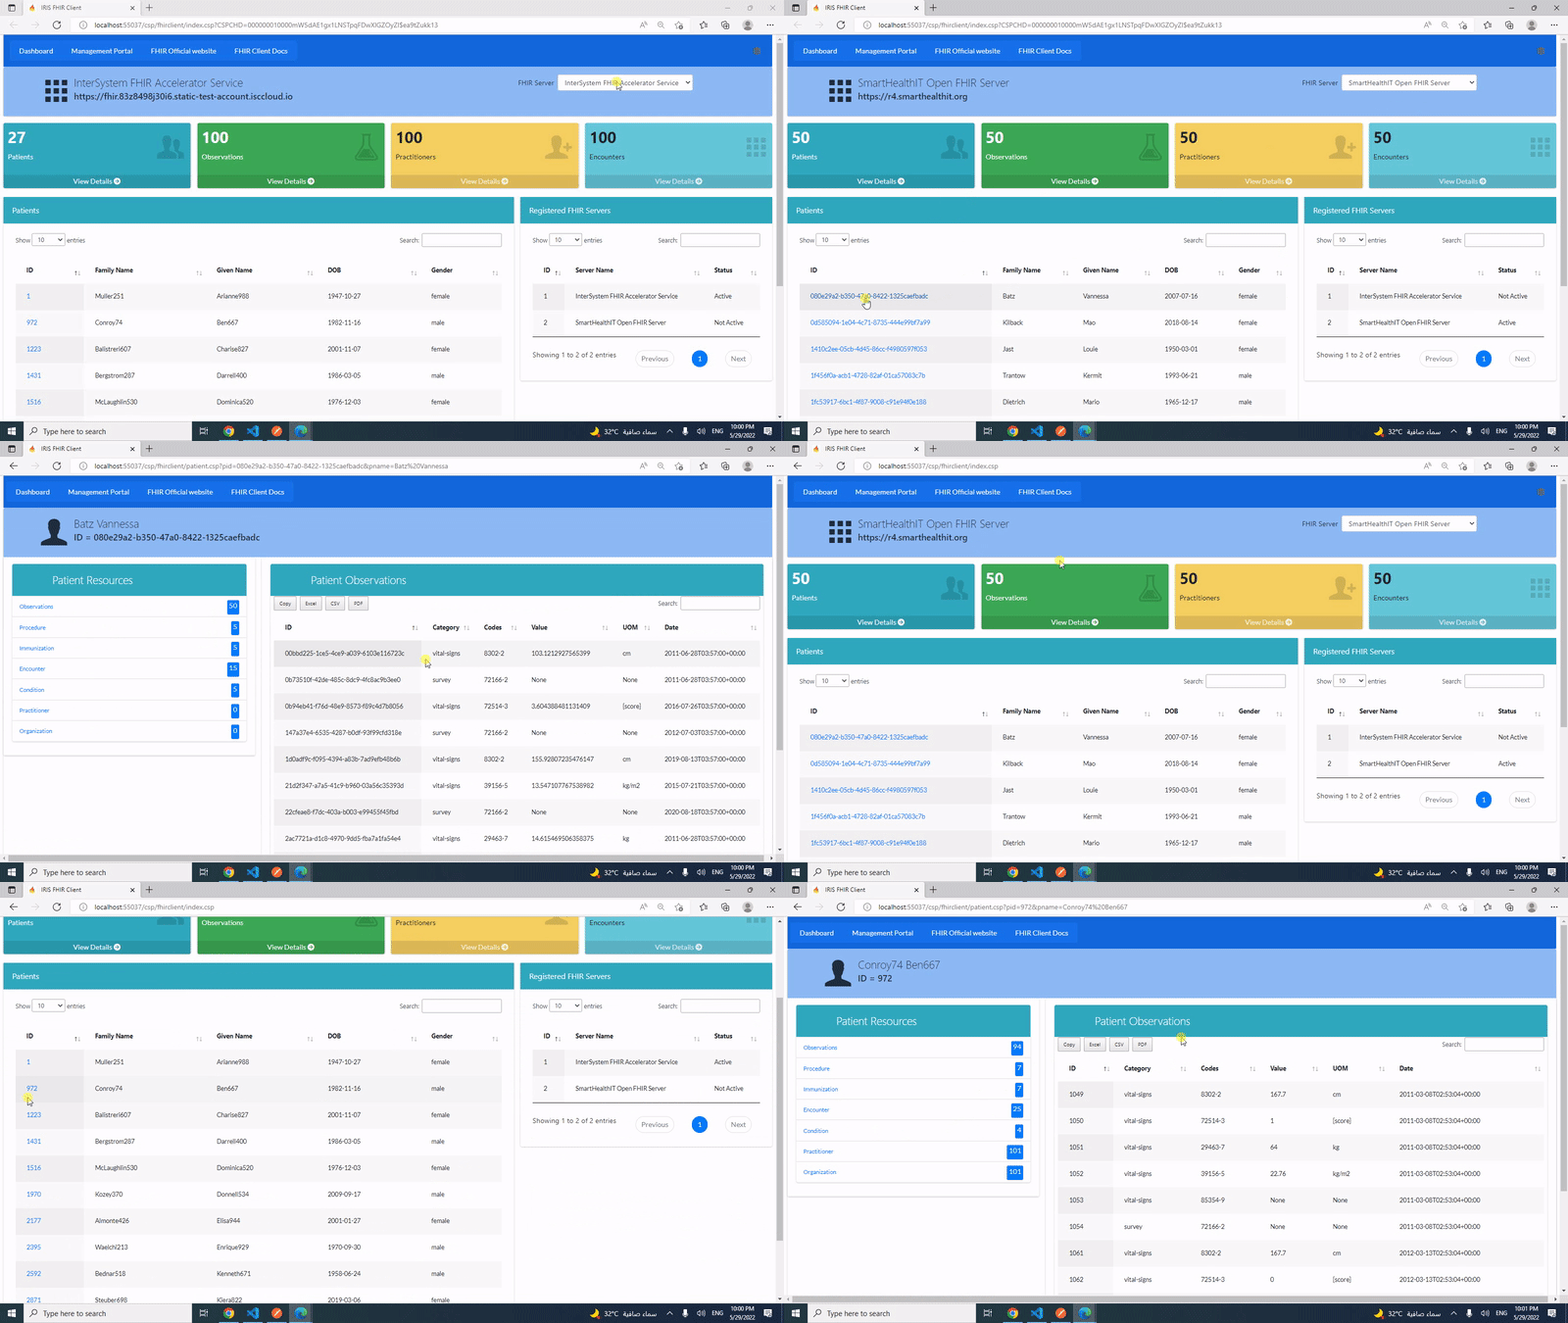
Hi Community,

This post is a introduction of my open exchange iris-fhir-client application.

iris-fhir-client can connect to any open FHIR Server by using embedded python with the help of fhirpy Library.
Get Resource information by terminal and by using CSP web application.

6 2
0 633

Released with no formal announcement in IRIS preview release 2019.4 is the /api/monitor service exposing IRIS metrics in Prometheus format. Big news for anyone wanting to use IRIS metrics as part of their monitoring and alerting solution. The API is a component of the new IRIS System Alerting and Monitoring (SAM) solution that will be released in an upcoming version of IRIS.

11 2
7 1.8K

I would like to define an advanced filter within my pivot table that allows me to look at diagnosis codes, or at procedure codes - but I do not want to hard code values within the pivot table definition (get the %OR defined).

I would like to be able to allow my dashboard user to chose what specific diagnosis codes or procedure codes they are interested in. So for example one user may want to look for # of patients with cancer dx or patients who have had a radiation procedure.

How can I accomplish this OR feature using dashboard filters?

0 2
0 381

In looking at the Production monitor within Ensemble, I was wondering if there is a way we could customize it for our use. I notice it is basically a dashboard.

For example I would only like to truly display those Services, Processes, and Operations that are truly in dire need of attention. The Monitor out of the box just seems too busy, and I would like to simplify it.

0 2
3 786

Dear Folks,

I have recently studied deepsee and developed few dashboards needed for our web app users. I am trying to embed them in our existing web app which uses angular with delegated user access. I need to embed the native IRIS dashboard into it. ( I can't use Highcharts or any other js tools).

How do I setup the dashboards to work with delegated authentication (Without providing access to management portal or other parts) ? Also should I use the default csp/{Namespace}/_DeepSee.UserPortal.DashboardViewer.zen? or any other web application URL ?

Thanks

0 1
0 176

Hi!

Sometimes I need to filter the widget on a dashboard from a different cube. And I face the following problem:

Widget A refers to a query from Cube A and I want to filter Widget B from Widget B.

Widget's B pivot refers to Cube B, and which has different dimensions for the same data.

E.g. cube A has the dimension Author and the Cube B has the dimension Member for the same data. So there is no way to filter such a widget B from the widget A.

1 1
1 316
Article
· Sep 11, 2021 5m read
iris-analytics-for-money

I regret getting a late start in the InterSystems Analytics contest. I had tried a couple of times before to use Analytics, but I had not gotten too far. I have been recording financial transactions in Excel workbook ever since I had to retire Microsoft Money. Since my iris-for-money was not fully functional, I created a worksheet per account I was tracking. I had developed a CSP page in iris-for-money to import transactions by reading a CSV file.

8 1
0 230

Creating information dashboards, pivot tables, and widgets is an important step in analysis that provides valuable sources of information for informed decision-making. The IRIS BI platform offers many opportunities to create and customize these elements. In this article, we will take a closer look at the basic techniques for developing them and the importance of using them.

6 1
0 332

Hi Community,

This post is a introduction of my openexchange iris-python-apps application. Build by using Embedded Python and Python Flask Web Framework.
Application also demonstrates some of the Python functionalities like Data Science, Data Plotting, Data Visualization and QR Code generation.

image

Features

  • Responsive bootstrap IRIS Dashboard

  • View dashboard details along with interoperability events log and messages.

  • Use of Python plotting from IRIS

  • Use of Jupyter Notebook

  • Introduction to Data Science, Data Plotting and Data Visualization.

  • QR Code generator from python.

4 1
0 4.2K