Creating information dashboards, pivot tables, and widgets is an important step in analysis that provides valuable sources of information for informed decision-making. The IRIS BI platform offers many opportunities to create and customize these elements. In this article, we will take a closer look at the basic techniques for developing them and the importance of using them.

6 1
0 288

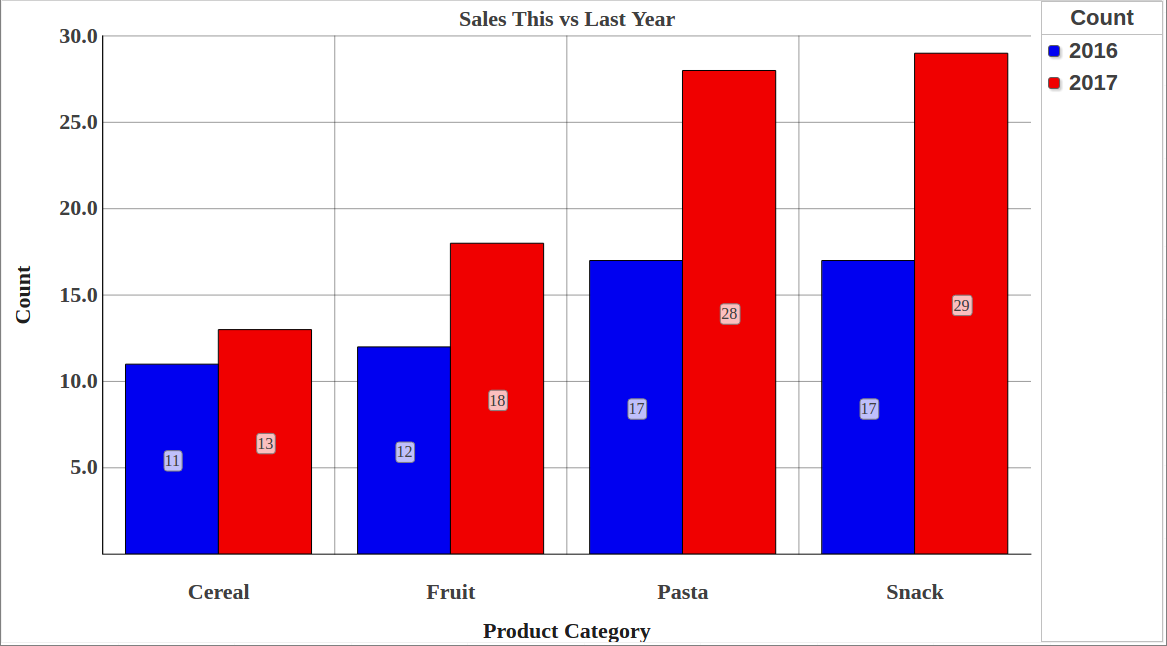
When analyzing data, there is often a need to look at specific indicators more thoroughly and to highlight sections of information of particular interest to a user.

For instance, examining the data dynamics for specific regions or dates can help us uncover some hidden trends and patterns that will allow us to make an informed decision about our project in the future.

1 0
1 217

Released with no formal announcement in IRIS preview release 2019.4 is the /api/monitor service exposing IRIS metrics in Prometheus format. Big news for anyone wanting to use IRIS metrics as part of their monitoring and alerting solution. The API is a component of the new IRIS System Alerting and Monitoring (SAM) solution that will be released in an upcoming version of IRIS.

11 2
7 1.7K

The following steps show you how to display a sample list of metrics available from the /api/monitor service.

In the last post, I gave an overview of the service that exposes IRIS metrics in Prometheus format. The post shows how to set up and run IRIS preview release 2019.4 in a container and then list the metrics.


This post assumes you have Docker installed. If not, go and do that now for your platform :)

17 10
5 1.1K

Hi Community,

This post is a introduction of my open exchange iris-fhir-client application.

iris-fhir-client can connect to any open FHIR Server by using embedded python with the help of fhirpy Library.
Get Resource information by terminal and by using CSP web application.

6 2
0 558
Article
· Sep 11, 2021 5m read
iris-analytics-for-money

I regret getting a late start in the InterSystems Analytics contest. I had tried a couple of times before to use Analytics, but I had not gotten too far. I have been recording financial transactions in Excel workbook ever since I had to retire Microsoft Money. Since my iris-for-money was not fully functional, I created a worksheet per account I was tracking. I had developed a CSP page in iris-for-money to import transactions by reading a CSV file.

8 1
0 213

The pandemic that struck the world in 2020 made everyone follow the news and the numbers that involve the COVID-19.

Why don’t you take that opportunity to create something simple and pleasant, to follow the number of vaccinations worldwide?

To face this challenge, I'm using the data provided by Our World in Data - Research and data to make progress against the world’s largest problems.

They have a dedicated repository on Github with the data of COVID-19, and I took the vaccination data to help me with my tracker.

4 4
0 302

Hi All,

With this article, I would like to show you how easily and dynamically System Alerting and Monitoring (or SAM for short) can be configured. The use case could be that of a fast and agile CI/CD provisioning pipeline where you want to run your unit-tests but also stress-tests and you would want to quickly be able to see if those tests are successful or how they are stressing the systems and your application (the InterSystems IRIS backend SAM API is extendable for your APM implementation).

4 0
1 619

Now available on Open Exchange is a library of third party charts available to use within DeepSee/InterSystems IRIS BI dashboards. To start, simply download and install, select the new portlet as the widget type, then select the chart type that you desire. If you don't find the type of chart you are looking for, you can easily extend the portlet to implement your desired chart type. These new chart types can be used within existing dashboards or you can create new dashboards using them.

4 0
0 808
Article
· Mar 2, 2020 2m read
SQL -99 error while viewing a listing

This error is sometimes seen while viewing a listing in InterSystems IRIS Business Intelligence:
ERROR #5540: SQLCODE: -99 Message: User <USERNAME> is not privileged for the operation (4)

As the error suggests, this is due to a permission error. To figure out which permissions are missing/needed, we can take a look at the SQL query that is generated. We will use a query from SAMPLES as an example.

1 0
0 688

Hello Community,

Thank you all for your continued feedback and support of our ad hoc reporting platform, VDM. There's been some questions around setting up a non-ODBC connection for InterSystems platforms. We published a new YouTube video showing the steps necessary to connect to InterSystems Caché and InterSystem IRIS with BridgeWorks VDM.

https://www.youtube.com/embed/NtH5w4AzmMY
[This is an embedded link, but you cannot view embedded content directly on the site because you have declined the cookies necessary to access it. To view embedded content, you would need to accept all cookies in your Cookies Settings]

2 0
3 216

In the previous part of this series, we saw how to include data in a portlet from within DeepSee. This used the built in data controller. In this part, we are going to be pulling in data from outside of DeepSee. This will include both information from within InterSystems IRIS and from the OS.

Why use this?

This is useful if you would like to create a dashboard that only contains information about your system. It is also useful if you want to display data about your system along side data that you have stored in DeepSee.

2 0
0 304

What is %SQLRESTRICT

%SQLRESTRICT is a special %FILTER clause for use in MDX queries in InterSystems IRIS Business Intelligence. Since this function begins with %, it means this is a special MDX extension created by InterSystems. It allows users to insert an SQL statement that will be used to restrict the returned records in the MDX Result Set. This SQL statement must return a set of Source Record IDs to limit the results by. Please see the documentation for more information.

Why is this useful?

This is useful because there are often times users want to restrict the results in their MDX Result Set based on information that is not in their cubes. It may be the case that this information may not make sense to be in the cube. Other times this can be useful when there is a large set of values you want to restrict. As mentioned before, this is not a standard MDX function, it was created by InterSystems to handle cases were queries were not performing well or cases that were not easily solved by existing functions.

6 0
1 523
Article
· Dec 31, 2019 3m read
Portlets that use data from DeepSee


In the previous part of this series, we saw how to reference a web page that will enhance our dashboard experience. Now we will look into referencing data that is already in our cubes.

In this example, we will be referencing the controller object and we will be extracting data from it. This data will then be displayed as text in our Dashboard. In Part 5, we will show how to incorporate this data into other charting libraries.

2 0
0 208

In the previous part of this series, we saw how to define a basic portlet. Now we will look into making this portlet reference a web page that will enhance our dashboard experience.

In this example, we will be embedding a Developer Community article along side a couple of widgets displaying information related to the number of views on the Developer Community articles. This example is not hosted on the Community Analytics server, but if it was we could see the view counts going up as we interacted with the page.

Why use this?

In a real case, perhaps you have an embedded page from an external web site showing the current Emergency Room wait times for Hospitals in your area. This portlet can be used along side widgets from your Emergency Room showing how many people are waiting, how many doctors are active, and how many people are being treated. As other Emergency Room wait times grow, you can possibly expect your volume to increase as well. This can help you make decisions on how to allocate resources.

1 0
0 365
Article
· Dec 12, 2019 2m read
Creating Portlets in DeepSee

What is a portlet?

The simple answer is: a custom widget. A portlet can exist by itself on a DeepSee dashboard, it can be used along side standard DeepSee widgets, or along side other portlets. The rendering of the custom widget is completely user defined. This means you can embed a web page, create a form to perform any sort of action needed based on the data on your dashboard, use third party charting libraries, or simply display data from outside of a DeepSee cube.

How to get started

6 1
0 427