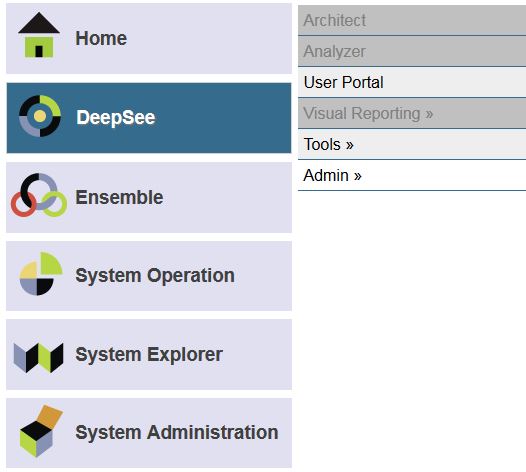
AnalyzeThis is a tool for getting a personalized preview of your own data inside of InterSystems BI. This allows you to get first hand experience with InterSystems BI and understand the power and value it can bring to your organization. In addition to getting a personalized preview of InterSystems BI through an import of a CSV file with your data, Classes and SQL Queries are now supported as Data Sources in v1.1.0!

6 4
0 560
Article
· Dec 12, 2019 2m read
Creating Portlets in DeepSee

What is a portlet?

The simple answer is: a custom widget. A portlet can exist by itself on a DeepSee dashboard, it can be used along side standard DeepSee widgets, or along side other portlets. The rendering of the custom widget is completely user defined. This means you can embed a web page, create a form to perform any sort of action needed based on the data on your dashboard, use third party charting libraries, or simply display data from outside of a DeepSee cube.

How to get started

6 1
0 440
Article
· Jul 27, 2018 4m read
Load a ML model into InterSystems IRIS

Hi all. Today we are going to upload a ML model into IRIS Manager and test it.

Note: I have done the following on Ubuntu 18.04, Apache Zeppelin 0.8.0, Python 3.6.5.

Introduction

These days many available different tools for Data Mining enable you to develop predictive models and analyze the data you have with unprecedented ease. InterSystems IRIS Data Platform provide a stable foundation for your big data and fast data applications, providing interoperability with modern DataMining tools.

6 2
2 1.3K

Hey Developers,

Enjoy watching this brief explanation of a new feature in IRIS RAD Studio – a new project by @José Pereira and @Henrique.GonçalvesDias:

Automated user management in IRIS RAD Studio

https://www.youtube.com/embed/-Y2kaKES8yg
[This is an embedded link, but you cannot view embedded content directly on the site because you have declined the cookies necessary to access it. To view embedded content, you would need to accept all cookies in your Cookies Settings]

6 0
0 246

What is %SQLRESTRICT

%SQLRESTRICT is a special %FILTER clause for use in MDX queries in InterSystems IRIS Business Intelligence. Since this function begins with %, it means this is a special MDX extension created by InterSystems. It allows users to insert an SQL statement that will be used to restrict the returned records in the MDX Result Set. This SQL statement must return a set of Source Record IDs to limit the results by. Please see the documentation for more information.

Why is this useful?

This is useful because there are often times users want to restrict the results in their MDX Result Set based on information that is not in their cubes. It may be the case that this information may not make sense to be in the cube. Other times this can be useful when there is a large set of values you want to restrict. As mentioned before, this is not a standard MDX function, it was created by InterSystems to handle cases were queries were not performing well or cases that were not easily solved by existing functions.

6 0
1 544

I just wrote up a quick sample to help a colleague load data into IRIS from R using RJDBC, and figured it's worth sharing here for future reference.

Ultimately it was pretty simple, aside from IRIS not liking "." in column names; the workaround is to just rename the columns. Someone better at R than me could probably provide some generic approach. smiley

5 2
2 231

This article contains the tutorial document for a Global Summit academy session on Text Categorization and provides a helpful starting point to learn about Text Categorization and how iKnow can help you to implement Text Categorization models. This document was originally prepared by Kerry Kirkham and Max Vershinin and should work based on the sample data provided in the SAMPLES namespace.

5 0
1 640

The following post outlines an architectural design of intermediate complexity for DeepSee. As in the previous example, this implementation includes separate databases for storing the DeepSee cache, DeepSee implementation and settings. This post introduces two new databases: the first to store the globals needed for synchronization, the second to store fact tables and indices.

5 5
0 683
Article
· Nov 26, 2019 3m read
Designing valid hierarchies in DeepSee

When designing a hierarchy in DeepSee, a child member must have only one parent member. In the case where a child corresponds to two parents, the results can become unreliable. In the case where two similar members exist, their keys must be changed so that they are unique. We will take a look at two examples to see when this happens and how to prevent it.

5 1
0 678

I've asked a lot of questions leading up to this, so I wanted to share some of my progress.

The blue line represents the number of messages processed. The background color represents the average response time. You can see ticks for each hour (and bigger ticks for each day). Hovering over any point in the graph will show you the numbers for that period in time.

This is super useful for "at a glance" performance monitoring as well as establishing patterns in our utilization.

5 2
0 481
Article
· Oct 24, 2022 10m read
PerfTools IO Test Suite

Purpose

This set of tools (RanRead, RanWrite, and the combined RanIO) is used to generate random read and write events within a database (or pair of databases) to test Input/Output operations per second (IOPS). They can be used either in conjunction or separately to test IO hardware capacity, validate target IOPS, and ensure acceptable disk response times are sustained. Results gathered from the IO tests will vary from configuration to configuration based on the IO sub-system. Before running these tests ensure corresponding operating system and storage level monitoring are configured to capture IO performance metrics for later analysis. The suggested method is by running the System Performance tool that comes bundled within IRIS. Please note that this is an update to a previous release, which can be found here.

5 1
0 578

Whether you are accessing DeepSee for the first time ever or you are configuring DeepSee on a new instance, there are two common issues that are encountered after clicking on the “DeepSee” option in the System Management Portal.

Issue #1: Architect/Analyzer is grayed out!

Issue #2: DeepSee must be enabled before use.

Issue #1: Architect/Analyzer is grayed out!

There are two common causes for this problem.

5 1
0 1.5K

This is my introduction to a series of posts explaining how to create an end-to-end Machine Learning system.

Starting with one problem

Our IRIS Development Community has several posts without tags or wrong tagged. As the posts keep growing the organization
of each tag and the experience of any community member browsing the subjects tends to decrease.

First solutions in mind

We can think some usual solutions for this scenario, like:

5 11
2 407

Today we will talk about Adaptive Analytics. This is a system that allows you to receive data from various sources with a relativistic data structure and create OLAP cubes based on this data. This system also provides the ability to filter and aggregate data and has mechanisms to speed up the work of analytical queries.

5 0
1 529

Hi Community!

We are pleased to invite all the developers to the upcoming InterSystems Analytics Contest Kick-off Webinar! The topic of this webinar is dedicated to the Analytics contest.

On this webinar, we’ll demo the iris-analytics-template and answer the questions on how to develop, build, and deploy Analytics applications using InterSystems IRIS.

Date & Time: Monday, December 7 — 12:00 PM EDT

Speakers:
🗣 @Carmen Logue, InterSystems Product Manager - Analytics and AI
🗣 @Evgeny Shvarov, InterSystems Developer Ecosystem Manager

5 4
0 229

IRIS BI

We offer you to embed business intelligence into your applications in order to give your users an opportunity to ask and answer sophisticated questions about their data. Typically, your application will include customizable dashboards that can provide insight into data from Business Intelligence models known as cubes.

In contrast with traditional BI systems that use static data warehouses, Business Intelligence keeps being constantly synchronized with the live transactional data.

5 2
0 481

One of the most important tasks of dashboards is, on the one hand, to help you perceive data in an aggregated form, and, on the other hand, not to lose the depth of immersion in the data if you need this. One of the tools that help us achieve this result is drill down. It enables us to display several hierarchical levels of data, from aggregated to detailed.

5 0
0 472

Hey Community,

See how cubes are constructed for use in business intelligence, and learn about SQL and MDX query languages. Physical and virtual cubes are used in InterSystems IRIS® Business Intelligence and Adaptive Analytics:

Introduction to Cubes in Business Intelligence

https://www.youtube.com/embed/l6XFj1JQ5Fw
[This is an embedded link, but you cannot view embedded content directly on the site because you have declined the cookies necessary to access it. To view embedded content, you would need to accept all cookies in your Cookies Settings]

4 0
0 316

Making a Chart using Intersystems IRIS + Python

How to use the IRIS Native API in Python to access globals and plot some charts.

Why Python?

With a large adoption and use in the world, Python have a great community and a lot of accelerators | libraries to deploy any kind of application.
If you are curious (https://www.python.org/about/apps/)

4 1
0 400

Hi,

While we're working on a new data product supporting the analytics development process, we'd like to test some of the UX (User eXperience) design elements on a real audience. If you've got some battle scars from earlier analytics work and are interested in participating, please complete this survey and we'll get in touch when we have something to show!

Feel free to share this survey with your data-savvy friends and colleagues if you think they match the profile.

Thanks in advance for your participation!

4 0
0 237

When you have been using cubes for business intelligence in a namespace for some time, you may find that there are many cubes in the namespace, only some of which are actively being used. However, it can be difficult to tell which cubes users are or are not querying, and maintaining unused cubes can be costly both in terms of storage and of computation to keep them up to date. This article provides some suggestions and examples for monitoring which cubes are in active use, and for removing cubes that you determine are no longer necessary.

4 2
2 408
Article
· Nov 19, 2020 6m read
OCR and NLP together into InterSystems IRIS

According to IDC, more than 80% of information it is NoSQL, especially text into documents. When the digital services or applications not process all this information, the business lose. To face this challenge, it is possible use OCR technology. OCR uses machine learning and/or trained image patterns to transform image pixels into text. This is important, because many documents are scanned into images inside PDF, or many documents contains images with text inside. So OCR are an important step to get all possible data from a document.

4 3
2 441
Article
· Oct 19, 2022 3m read
Ingestion and Querying Speed Test

The capacity of taking numerous records every second while also facilitating real-time queries simultaneously in real time is called Hybrid Transactional Analytical Processing (HTAP). It is also called Transactional analytics or Transanalytics or Translytics and is a very useful element in scenarios where there is constant flow of real time data coming from IIOT sensors or data on fluctuations in stock market, and supporting the need for querying these data sets in real-time or near real-time.

4 4
0 737

Now available on Open Exchange is a library of third party charts available to use within DeepSee/InterSystems IRIS BI dashboards. To start, simply download and install, select the new portlet as the widget type, then select the chart type that you desire. If you don't find the type of chart you are looking for, you can easily extend the portlet to implement your desired chart type. These new chart types can be used within existing dashboards or you can create new dashboards using them.

4 0
0 883

Hey Developers,

Please welcome the first session from InterSystems Virtual Summit 2020:

Creating InterSystems IRIS Analytics Solutions Using Docker & VSCode

https://www.youtube.com/embed/SgEEayfME9U
[This is an embedded link, but you cannot view embedded content directly on the site because you have declined the cookies necessary to access it. To view embedded content, you would need to accept all cookies in your Cookies Settings]

4 1
1 174

The pandemic that struck the world in 2020 made everyone follow the news and the numbers that involve the COVID-19.

Why don’t you take that opportunity to create something simple and pleasant, to follow the number of vaccinations worldwide?

To face this challenge, I'm using the data provided by Our World in Data - Research and data to make progress against the world’s largest problems.

They have a dedicated repository on Github with the data of COVID-19, and I took the vaccination data to help me with my tracker.

4 4
0 327