 Open Exchange
InterSystems IRIS BI User Portal Artifacts into Container Classes
The InterSystems IRIS has a very nice container class to allows you have your Dashboards as classes source code. It is %DeepSee.UserLibrary.Container.
With this class is possible group all your dashboard and pivot table definitions.
This is useful to automatically create your dashboards when you build your docker project and other automation scenarios.
See:
Class dc.WebsiteAnalyzer.WebsiteAnalyzerBIContainer Extends %DeepSee.UserLibrary.Container
{
{
<items>
folderName="dc/WebsiteAnalyzer" title="Website NLP Analysis" description="" keywords=""
owner="" shared="true" public="true" locked="false" resource=""
timeCreated="2020-12-24T08:29:58.107Z"
createdBy="_SYSTEM" category="WebsiteAnalyzer" bookCover=""
scheme="" worklistCount="2" snapTo="true"
snapGrid="true" gridRows="10" gridCols="10" canResize="true"
canModify="true" showTitleBar="true" titleBarOpacity=""
titleBarColor="" selectedTitleBarOpacity="" selectedTitleBarColor=""
titleBarTextColor="" selectedTitleBarTextColor=""
titleBarFont="" companyName="" companyLogo="" companyStyle=""
backgroundColor="white" backgroundImage="none"
backgroundRepeat="no-repeat" backgroundSize="100% 100%" backgroundOpacity="1"
widgetBorders="1px solid #F0F0F0"
widgetBordersSwitch="edit" widgetBordersColor="#F0F0F0" widgetBordersStyle="solid"
widgetBordersWidth="1" widgetBordersToggle="true">
<widget name="WebsiteAnalyzerTableWidget" type="pivot" subtype="pivot" subtypeClass="lineChart"
title="" dataSource="TopEntities.kpi"
dataLink="" drillDownDataSource="" width="200" height="200" sidebarContent=""
showSidebar="false" sidebarWidth=""
maximized="false" homeRowL="0" homeColL="0" colSpanL="5" rowSpanL="5"
showToolbar="true" showToolbarBottomBorder="true"
showToolbarOnlyWhenMaximized="false" colorToolbar="#F0F0F0" opacityToolbar="1"
backgroundColor="#F0F0F0" opacity="1" theme="" dataColorList="">
</widget>
<widget name="WebsiteAnalyzerChartWidget" type="pivot" subtype="barChart"
subtypeClass="barChart" title=""
dataSource="TopEntities.kpi" dataLink="" drillDownDataSource=""
width="200" height="200" sidebarContent=""
showSidebar="false" sidebarWidth="" maximized="false" homeRowL="0"
homeColL="5" colSpanL="5" rowSpanL="5"
showToolbar="true" showToolbarBottomBorder="true" showToolbarOnlyWhenMaximized="false"
colorToolbar="#F0F0F0" opacityToolbar="1" backgroundColor="#F0F0F0"
opacity="1" theme="" dataColorList="">
</widget>
</dashboard>
</items>
}
}
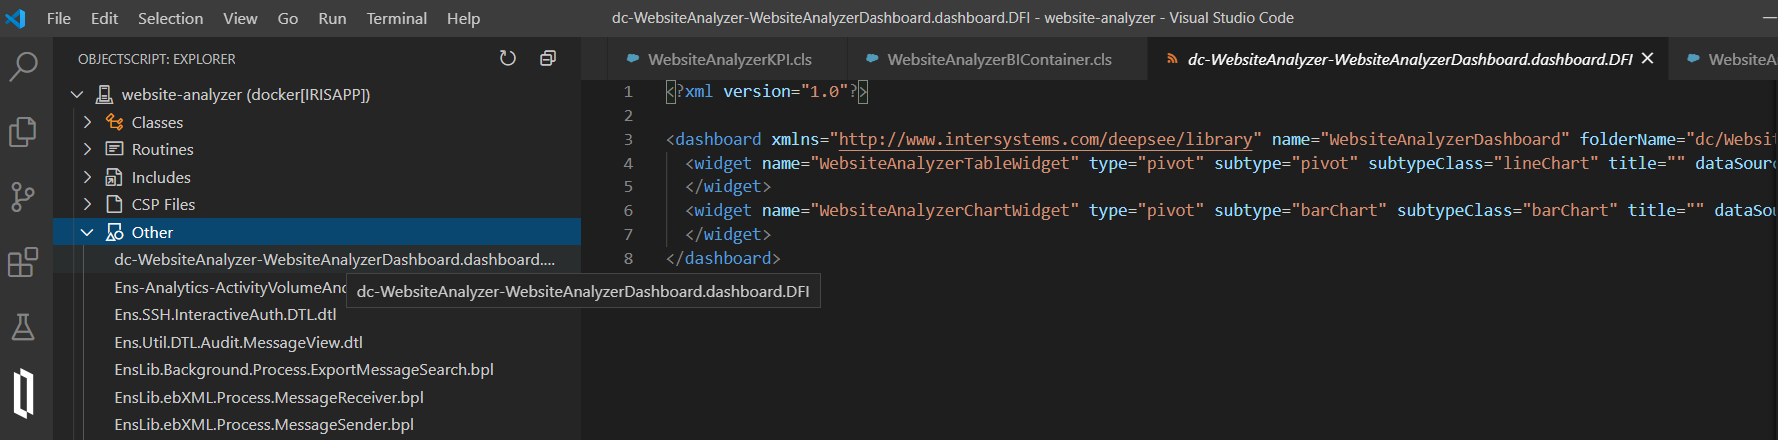
So, you create your dashboards and pivot tables, connect to your instance using VSCode, go to other and get your dashboard and pivot definitions. Finally paste these definitions in your container class. Easy!
See:
This sample can be found in this the Open Exchange link.