How To Display Custom SDA Extensions in the Clinical Viewer (Sneeziness Example)
How To Display Custom SDA Extensions in the Clinical Viewer
____________________________________________________________________________
Written by Sebastian Musielak, InterSystems Support, November, 2016
A new feature introduced in HealthShare Version 15 is the ability to create custom SDA extensions to store custom data in SDA. In some cases, it might be nice to display that new data in the Clinical Viewer. This is a step-by-step guide for how to do that.
To begin, we will make a few assumptions:
A – This guide was created running HealthShare version:
Cache for Windows (x86-64) 2016.1.2 (Build 208U) Thu Aug 18 2016 16:25:50 EDT [HealthShare Modules: Core:15.01.6402 + Linkage Engine:15.0.6402 + Patient Index:15.0.6402 + Clinical Viewer:15.01.6402 + Active Analytics:15.0.6402]
B - Assume that the custom SDA Extension has already been configured according to the documentation. For the purposes of this guide, we will be using the “sneeziness” extension, which is an example in the HealthShare 2015 documentation for adding a new field called “sneeziness” to the Allergy SDA.
For more information about customizing the Allergy SDA, please see the HealthShare Version 15 documentation on the subject of “Customizing the SDA” and specifically the subsection on “Using the Extension Classes to Customize the SDA”.
C - We will also assume that the TrakCare Layout Manager has already been configured to allow customization of the clinical viewer.
For more information about configuring the system to use the Layout Editor, please search for the HealthShare Version 15 documentation for the subject of “Required Setup for Clinical Viewer Customization”.
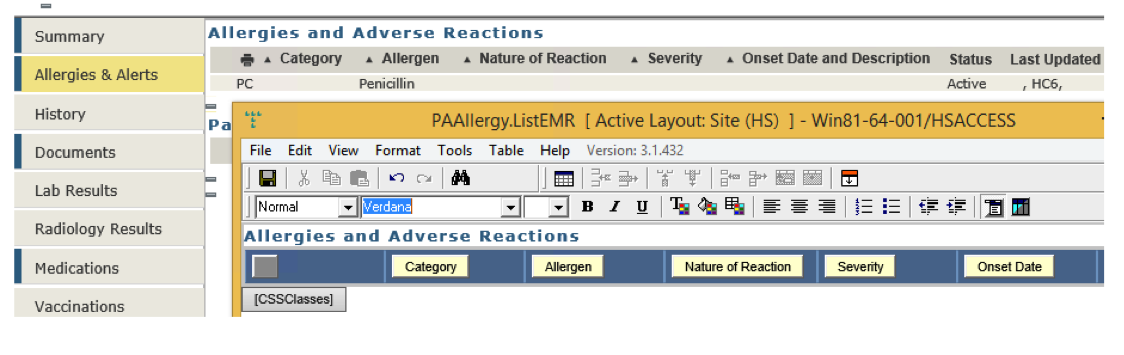
1) Open TrakCare Layout Editor
We will start by going into the TrakCare Clinical Viewer and opening the Layout Editor for the chart, which we want to customize. In this case, we want to customize the Allergies and Adverse Reactions Chart.
2) Change an existing column name to suit your needs
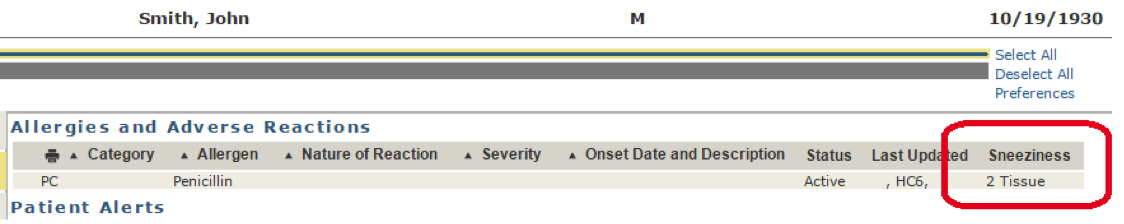
In the list of Columns available in the Layout Editor (Category, Allergen, Nature of Reaction, etc.), pick a column that is not used to store any data or that contains data you might not care about. This will be the column in which we display our “Sneeziness” value. For example, I chose to use “External ID”. Double click on the text to edit the column name to “Sneeziness”. Save the chart under the desired site.
When you reload the Clinician Viewer, it still will not contain a column for Sneeziness because the column is hidden. That must be changed.
3) If the Column is hidden by Default, Display It
Open the Column Editor by Double Clicking on the row of columns. Drag the Sneeziness tab from the bottom list of tabs (the hidden tabs) to the top list of tabs (the viewed list). Apply the changes.
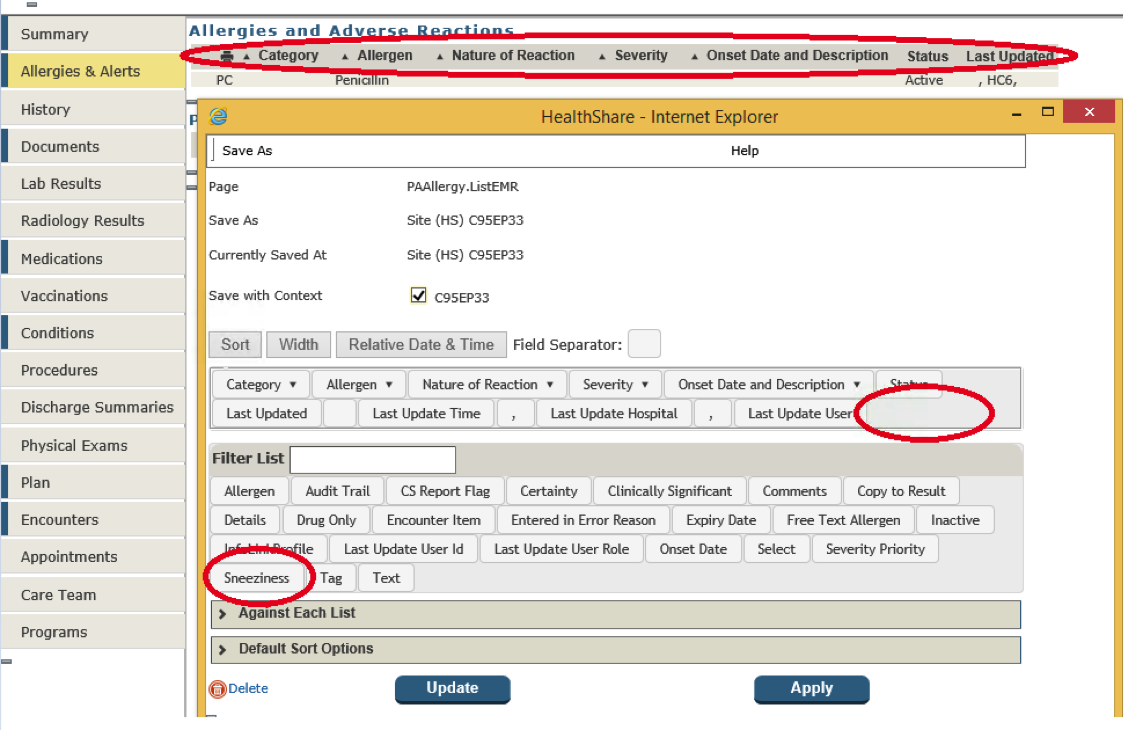
The Sneeziness column should now appear in the row of columns. But there is no data listed. We need to write code to pull the data out of the Clinical Viewer cache. We will do this using a custom class and classmethod. Once we have created the class, we need to

4) Write Code to Extract the Custom Data
Create a new class and create a classmethod in the namespace you have your Access Gateway. For example, I created a class called “User.SDAExtension” and a classmethod called “GetSneezinessViewerTransform”.
Since not all implementations are exactly the same, it is a good idea to understand the underlying workflow that allows data to be displayed in the Viewer. The HTML code that displays the Clinical Viewer is actually generated by dozens of HealthShare routines with names like “GCOMx.y.mac”, where x and y are numbered between 10 and 50. The HTML code is also generated from code with the name like “gen.ComponentXRef.X.Y.LZmac”, where X, Y, and Z are other numbers.
The GCOM and ComponentXRef code is, in turn, generated by changes made in the Layout Editor. It is important to understand that changes in the Layout Editor will update the GCOM and ComponentXRef routines, which will change the generated HTML. To find which piece of code generated the HTML, you can use your Chrome, Firefox or IE browser tools to inspect the page (or frame) source. The page and frame source will tell us the routine which generated that piece of HTML. For example, when we inspect the frame source for the data in the Allergies and Reactions table, we see the following HTML code:
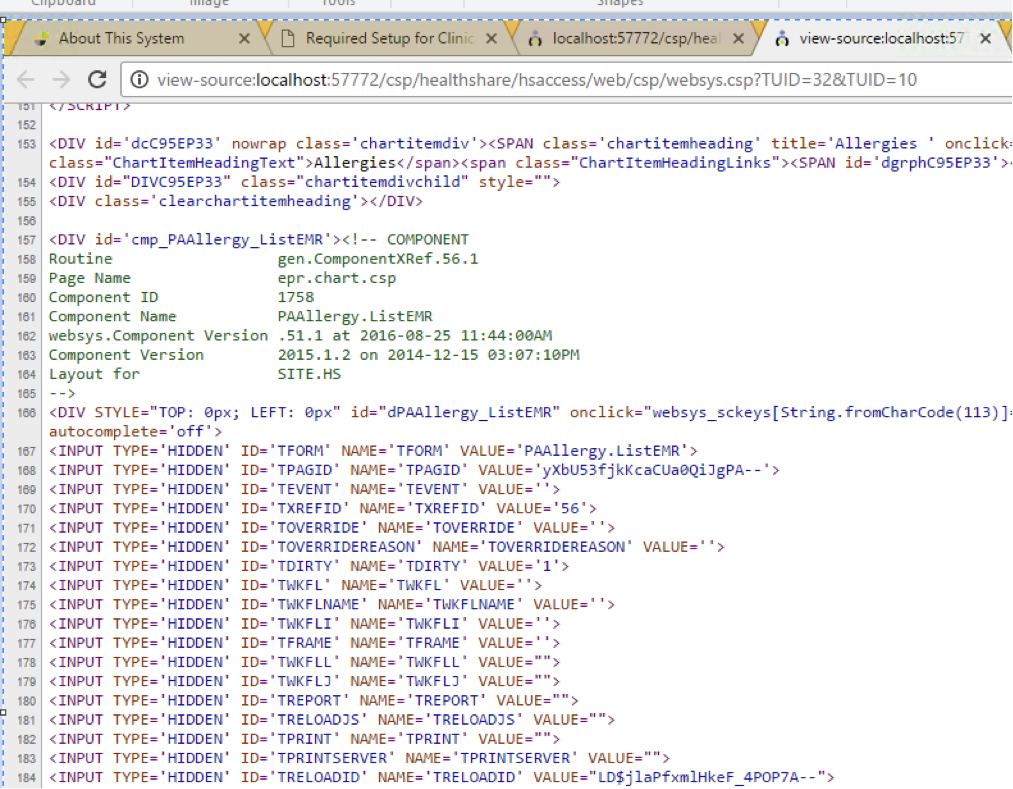
You will notice that our Allergy HTML code is generated by gen.ComponentXRef.56.1. Eventually, we see where we define the Row ID (covered in the next step). With the Row ID, id ,we can extract the patientid.
With the patientid, we can do a lookup for the aggregation key, agkey, for that patient using the ^CacheTemp.HS.ViewerStreamlet global. You can look at this global in the portal after loading a Patient into the viewer in another browser tab.
The agkey allows us to find the Streamlet ID, streamletID, assuming we know what kind of streamlet we want. In our example case, we want to find the streamletID for the Allergy Streamlet. The streamletID corresponds to the Object/Table row on disk, which stores our custom extension data.
We can bring the object into memory using the %OpenID() method. This allows us to pass the SDAString property of the Streamlet Object into a Utility method, XMLImportSDAString(), which will allow us to parse the SDA structure and extract the Sneeziness property.
This code is actually run by the Server-Side process which accepts commands from the Clinical Viewer UI. A lot of the variables are already in memory and we just need to write code to find the data we need.
Class User.SDAExtension Extends %Persistent
{

ClassMethod GetSneezinessViewerTransform(id) As %String
{
  set patientid=$p(id,"||")
  set agkey= $g(^CacheTemp.HS.ViewerStreamlet("HSACCESS","P",patientid))
  set streamletID= $g(^CacheTemp.HS.ViewerStreamlet("HSACCESS","V",agkey,"ALG",id))
  set obj=##class(HS.SDA3.Streamlet.Allergy).%OpenId(streamletID)
  set allergySDA3=##class(HS.SDA3.Allergy).%New()
  set st=allergySDA3.XMLImportSDAString(obj.SDAString)
  set sneeziness=allergySDA3.Extension.Sneeziness

  quit sneeziness
}

}
5) Create a Transform which Calls your Custom Code
Now that we have code that can run on the clinical viewer to get the Sneeziness, we need to define a transform to run that code. Go back to the Trak Viewer Home Page and click on Tools  . Click on “Code Table Map”, open the “System Management” expansion box, and click on “Transformation” to bring up the Transform Wizard.
Click “New” to create a new Transform.
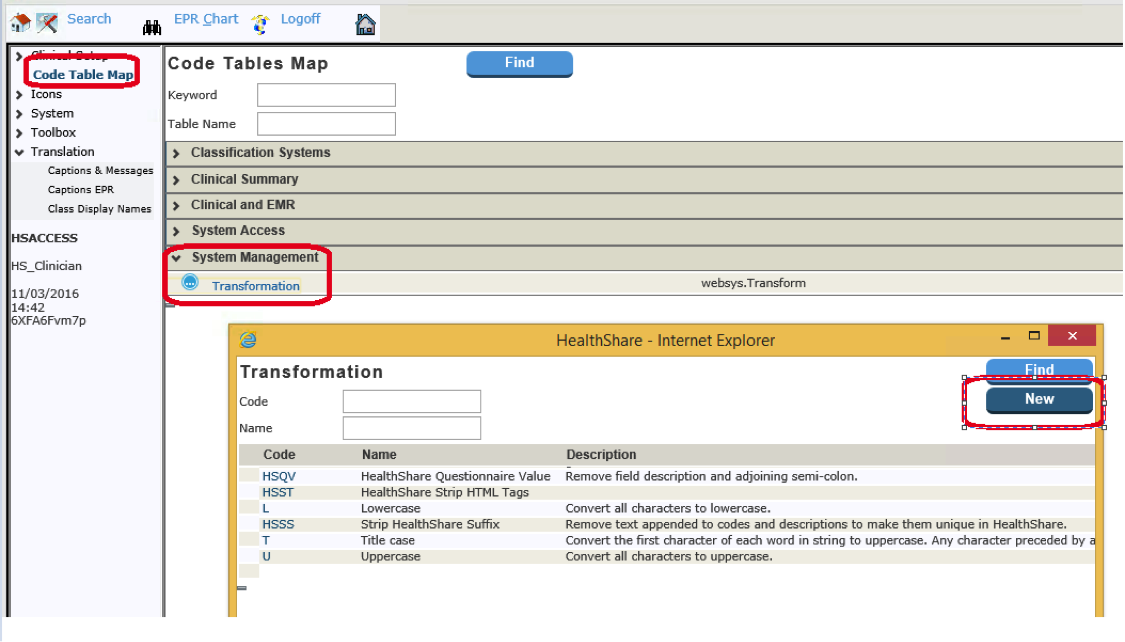
Set the following fields in the Transformation:
Code: GetSneeziness
Name: GetSneeziness
Description: Get the sneeziness from the SDA3 extension
Expression: set val=##class(User.SDAExtension).GetSneezinessViewerTransform($g(rs.Data("RowID")))
Owner: Site
The expression gets the ID of the row from the CSP Session data and sends to the Class for processing. We found this by digging through the ComponentXRef code and finding where we specify Row ID. From that, we can find the PatientID, StreamletID and eventually extract the Sneeziness.
Note that all expressions in the Layout Editor expect the format:
SET val=<insert some COS code>
Update the Transformation and confirm that it shows up in the list of transformations. Now, we need to configure the Clinical Viewer to call the transform to get the data to show up.
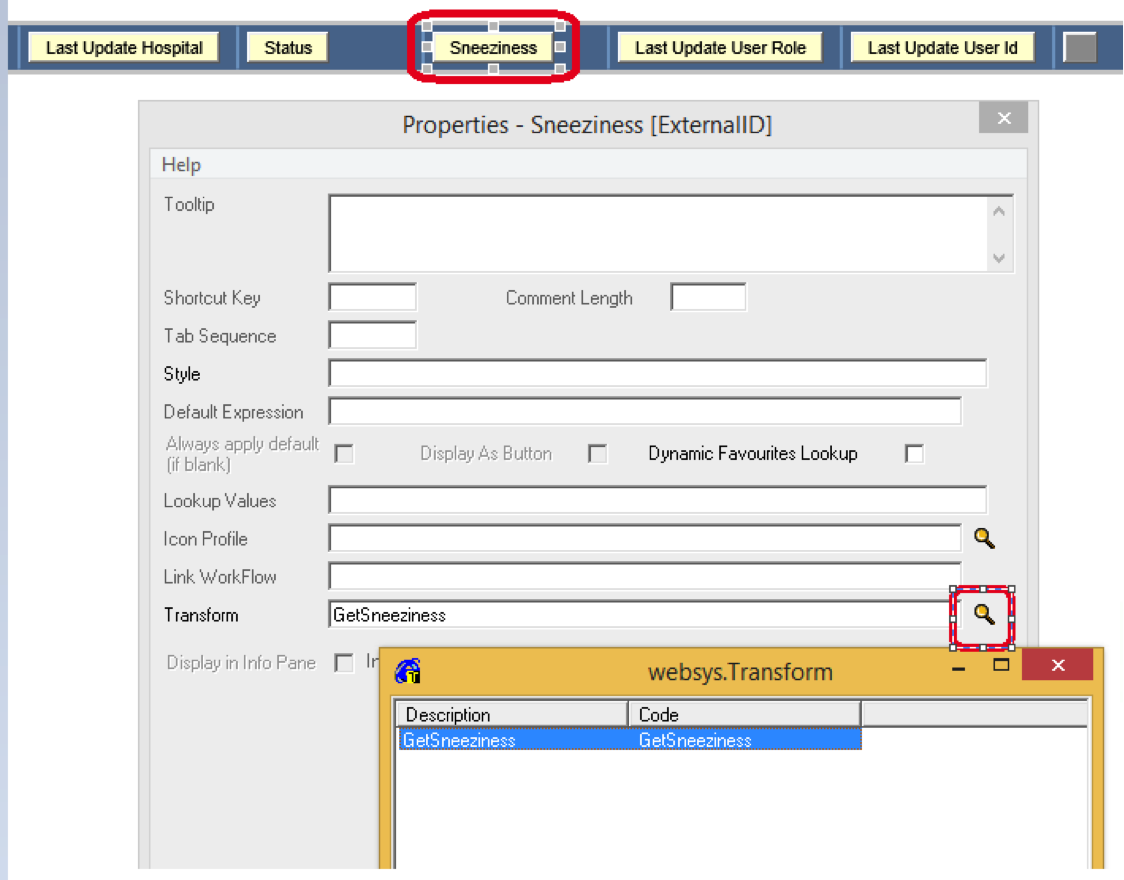
6) Specify your transform to be used in the Layout Editor
Go back to the Layout Editor for the Allergies and Adverse Reactions Chart. Right-Click on the Properties for the Sneeziness column (see Action 2 of this guide). Select the Search button next to the Transform setting. This should allow you to choose the Transform we created in the previous action.
At this point, assuming you already have data populated on disk in Information Exchange, you should be able to Log Out of the TrakCare Viewer and log back in to see the newly populated column.