Overview
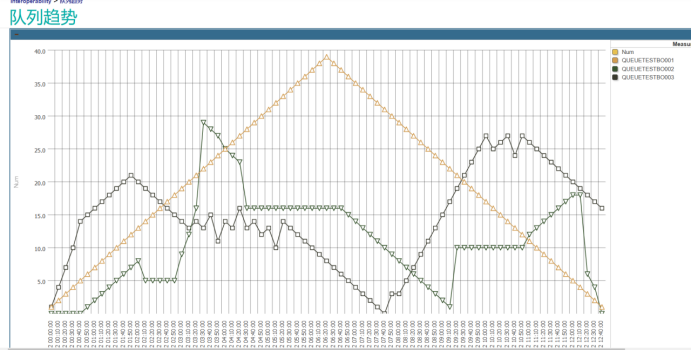
With the gradual improvement of hospital information construction, there are more and more business interfaces in hospitals. Due to the influence of various factors (network, consumer system, etc.), the data processing of business interface may cause excessive message accumulation and even the situation of interface card congestion, which affects the normal business development in the hospital. Therefore, the monitoring of the queue of business interface components becomes more and more important. At present, the built-in queue monitoring interface of Intersystems IRIS platform only displays real-time queue information of interface components, which is limited to provide queue data information required for practical application scenarios in hospitals. The queue monitoring component program is developed based on the Intersystems IRIS platform. It can monitor all interface components in a unified manner, display the queue information of components within 24 hours, and query the historical queue data of components by setting a time period, so as to better meet the current application requirements in the hospital. Key applications: IRIS, Analytics **Application introduction** By configuring this program component, you can realize real-time unified monitoring of message queues of production and operation components in Intersystems IRIS platform and display the current 24h queue trend of service interface components. You can also display the historical queue trend in a specified time range. You can use component history queue data to analyze whether the current service interface component configuration is reasonable and whether it needs to be optimized. By analyzing the trend of historical queue data, the frequency of queue number is generated. If an accident is caused by a queue problem, you can use the trend chart to quickly locate the start time of the queue and ID of the service event, which reduces the troubleshooting time and greatly improves the troubleshooting efficiency. **Future Application Scenarios** 1. Configure the running pool of the intelligent optimized component 2. Queue monitoring alarms 3. Highlight the top5 in the queue 4. Collect statistics on the frequency of component queue problems **Program deployment** 1. Create a new namespace and production on the installed instance, and import the application code 2. Create a scheduled task for extracting queue information for the namespace 3. Access Path View queue information *\*\\*\* is the default application name of the namespace http://ip:port/\*\***/Demo.QueueMonitoringPage.cls **How to test it** Prerequisite: Since the program is used to monitor queues, production needs to be enabled for the namespace. If not, you can open the built-in program code production (**Demo. Test. Production. TestProduction**) and enable it. 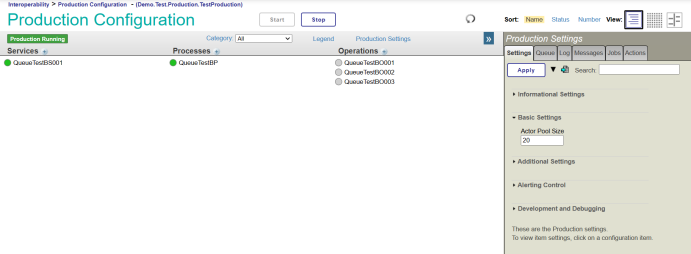 The application code to import the existing namespace, by **Demo. QueueMonitor. Task. QueryQueue** class new timing Task, and set the run every ten minutes extract queue information at a time. 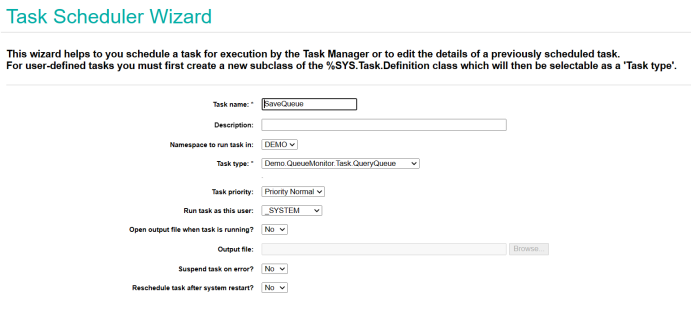 Access the url (http://ip:port/ \* \* \* \* / Demo. QueueMonitoringPage. CLS) can see the queue trend of statistics 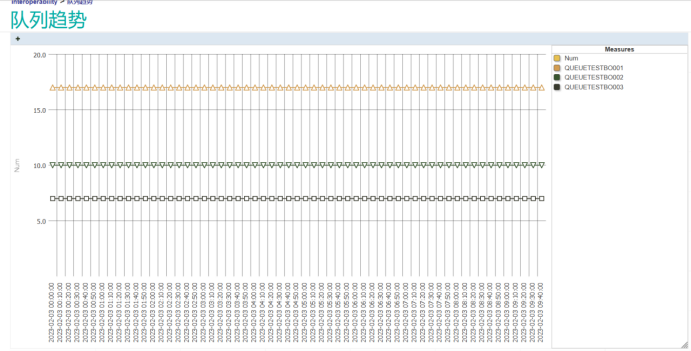 If the current prodution has no queue information, you can view the demo data by running the code set **^QueueData=1**. Don't forget to check and then do set **^QueueData=0**. Enables the program to monitor real-time data.