Power BI
Connecting to a Data Source
To connect to AtScale, we will use the SQL Server Analysis Services database. Let's open it in the Power Query editor. To do that, select Transform Data on the Home.

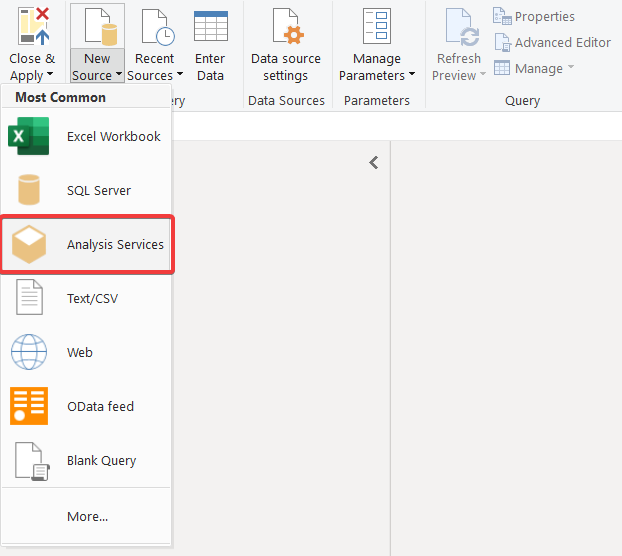
In the window that appears, go to the Home, expand New Source and select Analysis Services.
In the Server line, you need to specify the MDX link to the published project in AtScale. You can also immediately indicate the name of the project in the Database line if you wish to.
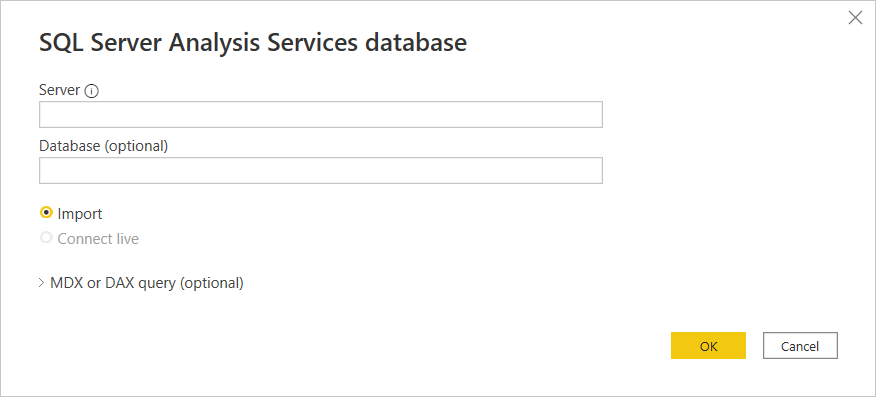

Next, you need to select the Basic type of authorization and specify the login/password from AtScale.

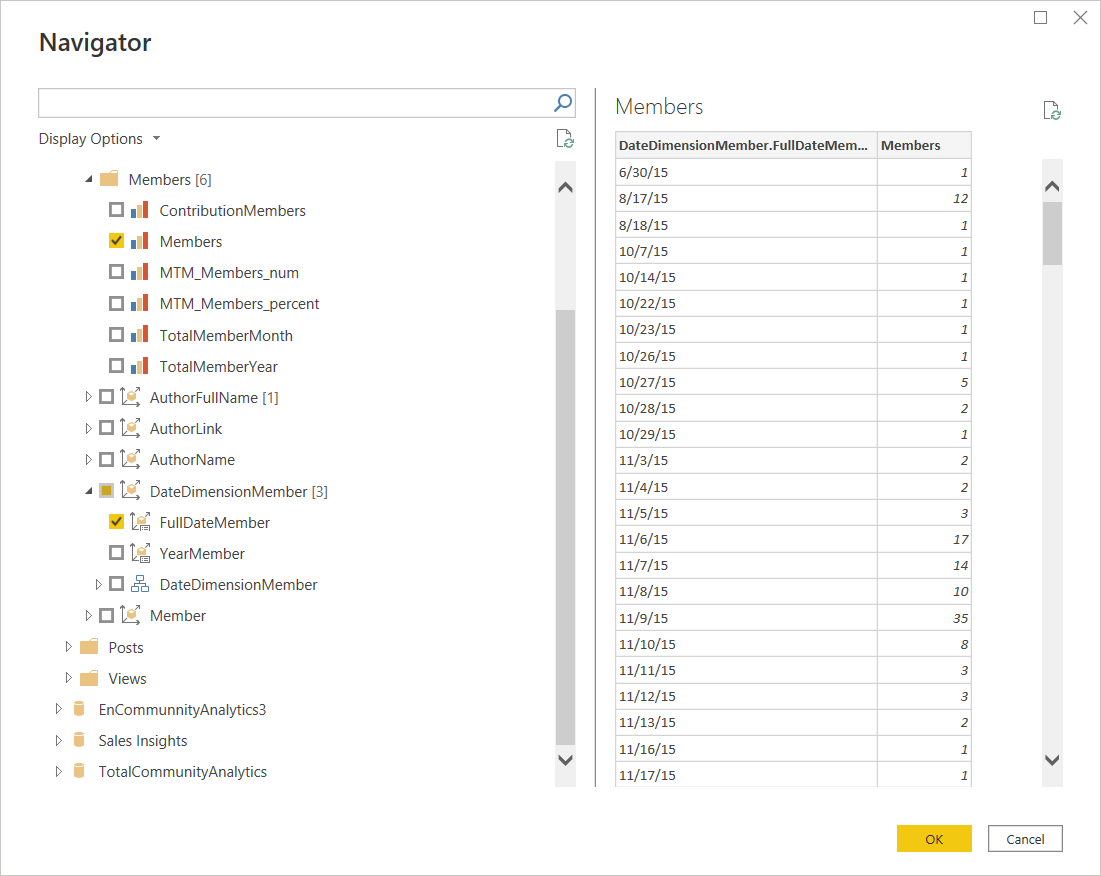
In the Navigator, you need to specify the necessary measures and dimensions (keep in mind that if there is no connection between the fields, you will not be able to build a correct query). It is also a good idea to split the cube into several tables, depending on the task. It will help you improve performance and avoid errors.
In order to set up automatic updates, you must use Power BI Gateway and Windows authorization. In this article, we will skip these steps.
However, you can read more about this subject in the AtScale documentation.
Features of creating queries in Power Query.
After adding columns, you can make changes to the table (modify the column name, data type, add/change columns, replace values, etc.).
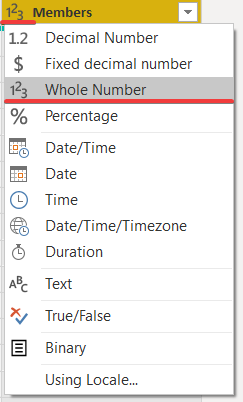
For instance, you can alter the name of a column. To do this, double-click on the column name. It is advisable to make sure that there are no blank fields in the numeric values. All empty values must be marked as null. If you have vacant fields, just override the field type. To make it happen, click on the type icon to the left of the column name and pick the required type.
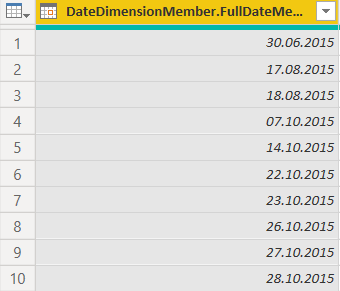
Power Query may not correctly identify the data type. In this example, it incorrectly recognized the date format.
To fix this, we appoint a specific date format. To do that, click on the icon data type, Use Locale…

In our case, we'll pick the Date and the English (United States) locale.

Now the date is displayed correctly.
You can learn more about working in Power Query from the official documentation.
Working in Power BI and creating visualizations.
Creating a date table using DAX functions.
In order for our tables to be related by date, we will create a calendar based on the available dates using the built-in DAX language.
One way to create a date table is to use the built-in DAX function recommended, as there may be extra start or end dates, such as employee birthdays, so it's better to set them manually in the CALENDAR. These functions return all days between the minimum and maximum dates.
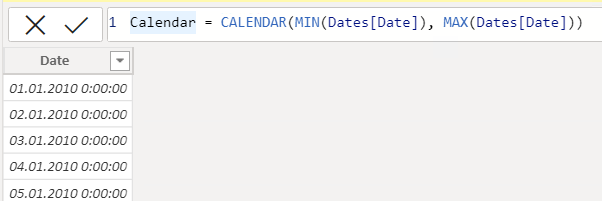
Calendar = CALENDAR(<start_date>, <end_date>))
Now let's add a column with the year and the name of the desired name of the month. You can use a date hierarchy to get the year and the name of the month. On the Column Tools, click the New Column button and write the formula.
Month = 'Calendar'[Date].[Year]
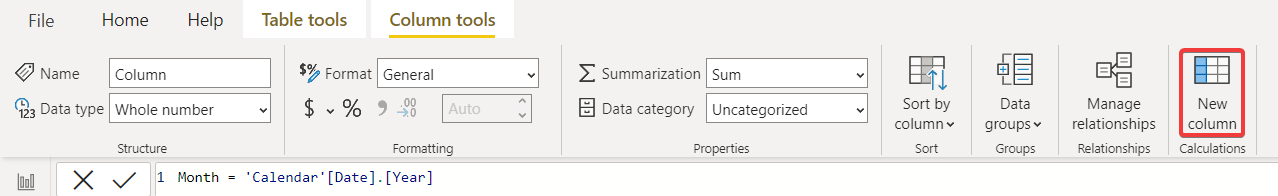
In DAX, the formula is preceded by the column name. The = denotes the beginning of a formula. Then the formula itself is written. In our case, we simply take the [Year] from the calendar date. It is always recommended to write the table name, but you can just write [Date].[Year]. Power BI will refer to the existing Date column inside the table.
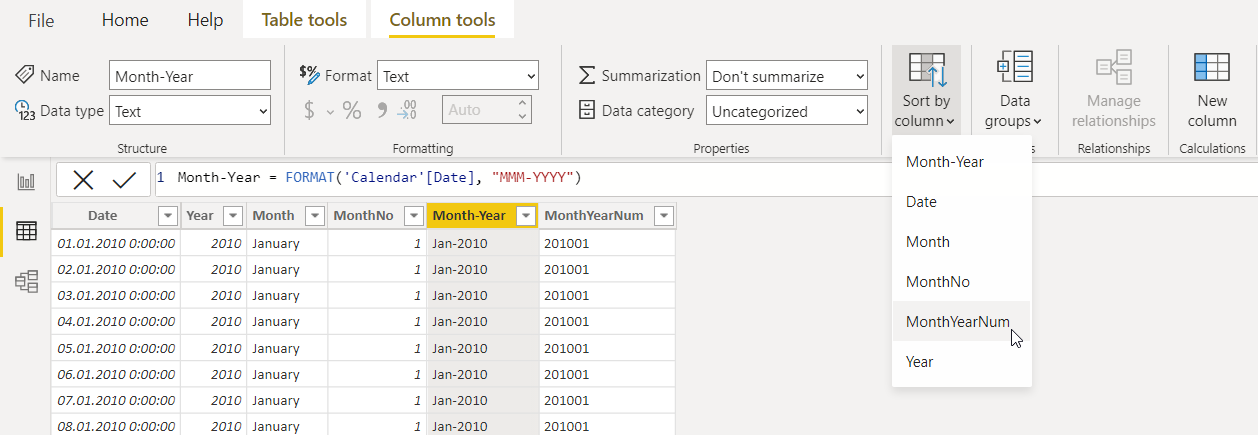
Let's add a column in the format (MMM-YYYY). To do this, we will write the FORMAT function.
Month-Year = FORMAT('Calendar'[Date], "MMM-YYYY").
However, since the Month and Month-Year fields are text fields, they will be sorted alphabetically. Let's create columns for correct sorting: MonthNum with the numeric value of the month for the Month column, and MonthYearNum for the Month-Year column.
MonthYearNum = FORMAT('Calendar'[Date], "YYYYMM")
Now we need to set the sort column. Go to Column Tools select Sort by and select the required column. Let's carry out the same manipulation for the rest of the columns with text fields.
To better understand DAX formulas, you can take lessons on the official website of Microsoft.
Managing Data
Model view in Power BI Desktop allows you to define the relationship between tables or items visually. In this case, two or more tables will be linked because they contain related data. It allows users to access related data across multiple tables. In the Model view, you can see a schematic representation of the data.
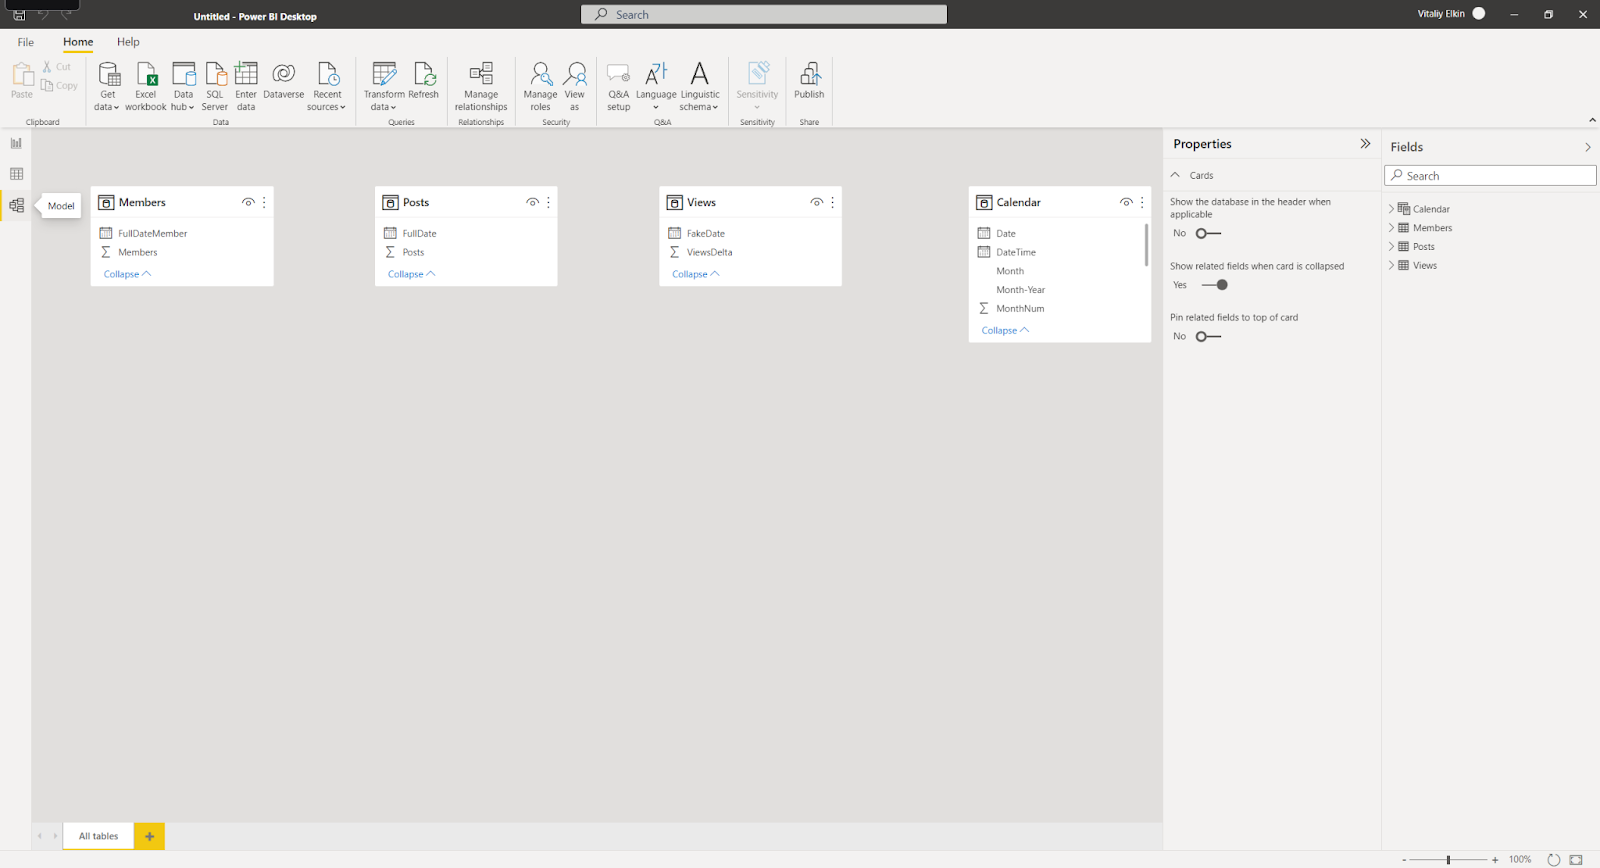
Adding and removing links is very easy. To create a link, drag the fields you want to a link between tables. To remove a link, right-click and select Delete.
For a more detailed understanding of Data Links, on the Home go to Manage relationships. Dialog box Manage displays links as a list rather than a visual diagram. In this dialog box, you can select Autodiscover to find relationships between new or updated data. Pick Edit to manually modify links. The edit section contains additional parameters that allow you to set the multiplicity and direction of cross-filtering for links.

Your options for Cardinality are explained in the following table.
<colgroup><col width="129"><col width="471"></colgroup>
|
Cardinality Options
|
Example
|
|
Many to One
|
The most common default relationship. A column in the same table can have more than one instance of a value. The associated table (or lookup table) has only one instance of the value.
|
|
One to One
|
A column in one table has only one instance of a particular value, and another related table has only one instance of a particular value.
|
Generally, we recommend minimizing the use of bi-directional relationships. They can have a negative impact on model query performance, and possibly deliver confusing experiences for your report users.
Setting accurate relationships between your data allows you to create complex calculations across multiple data elements.
More information about data models can be viewed here.
Slicers
A simple filter that can be used directly on a report page is called a slicer. Slicers provide hints on how you can filter results in visuals on a report page. There are different types of slicers: numeric, by category, and by date. Slicers help you effortessly filter all the visuals on a page at once.

This GIF shows the work of a standard slice. You can set up multiple selections in order to select various options without Ctrl.
To do this, select slicer; then in the Visualizations panel choose the Format visual tab; open Selection, and toggle Multiple selection pick Ctrl.

You can also change the appearance of the slicer. To make it happen, pick the down arrow in the upper right corner of the slicer element.
Adding a Visual Element to a Page
To add a visual element, select it in the Visualizations.
Let's add a Stacked column chart.
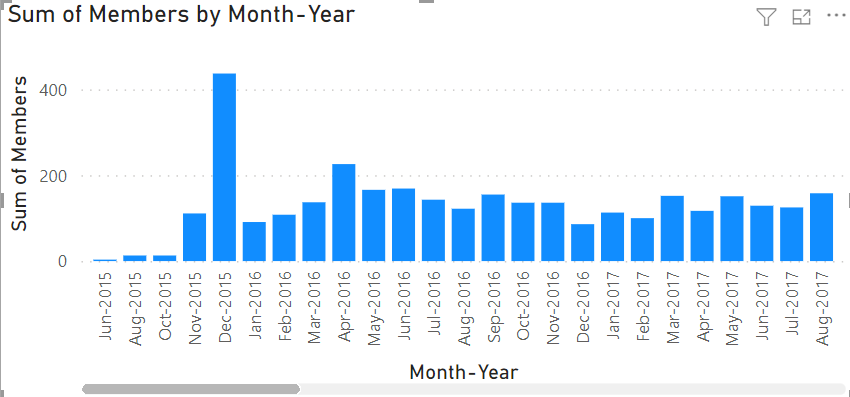
Now we need to select the fields we want to display. Let's add the Month-Year field from the Calendar and another numeric value from your table.
We should get something like this.
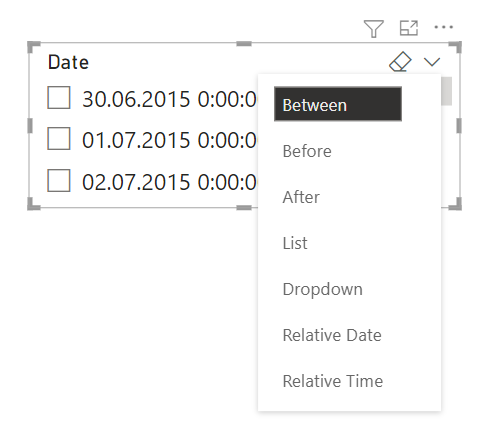
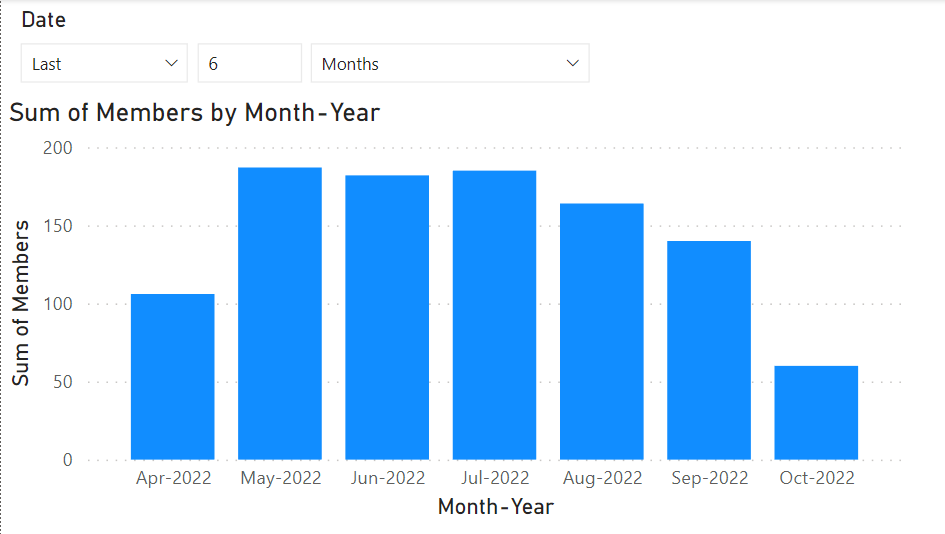
In order to truncate the data, we will add a filter by date. Let's extract the Date field from the Calendar and change its visualization type to slicer, then remove the standard hierarchy and use the usual date format. Afterward, we should immediately change the view type to a relative date.

Now we can apply a filter to screen the last 6 months.
You can change the view of the visualization on the formatting tab. Each visual element has special parameters. You can read more about it here.

There is also a tab with general options, such as title and background.

Let's add a few more visualizations and change their look a bit.
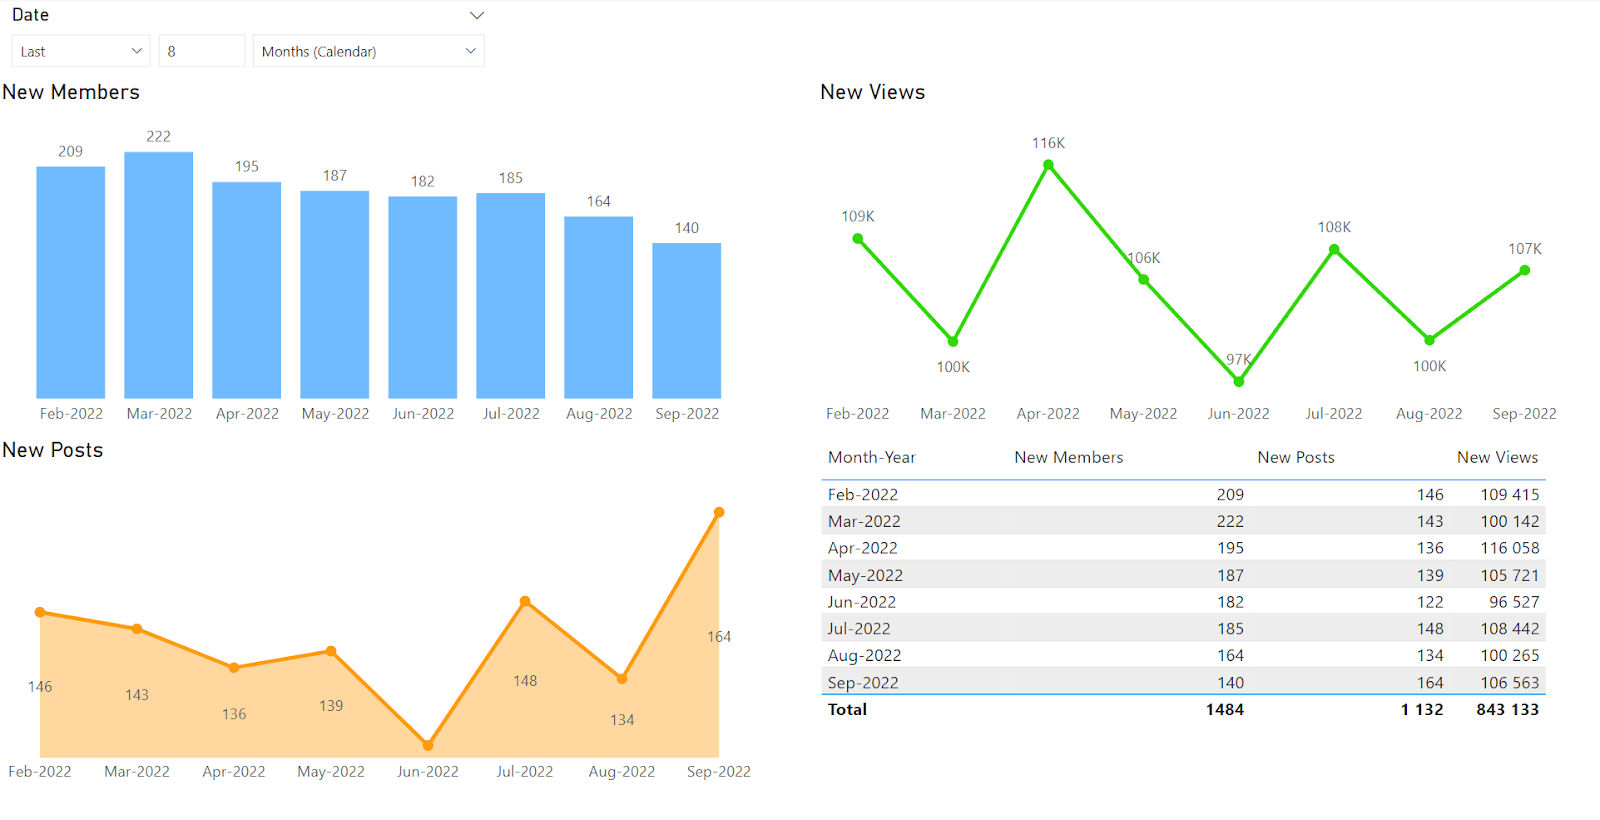
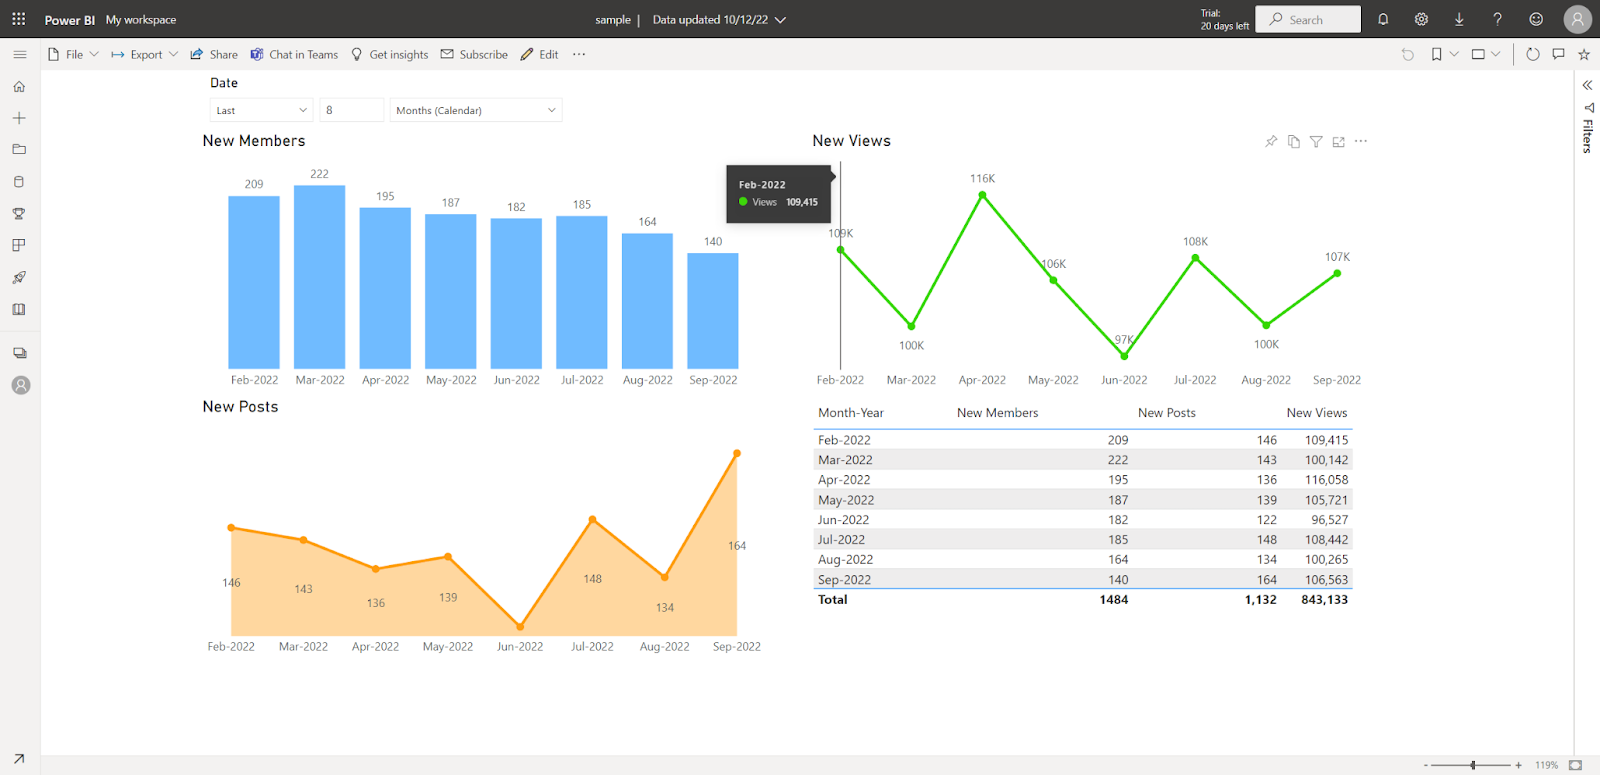
Now we have a simple dashboard example.
Publishing a report in app.powerbi.com
Reports are always published on the portal https://app.powerbi.com/home.
Therefore, you must have an account and be authorized in Power BI Desktop.
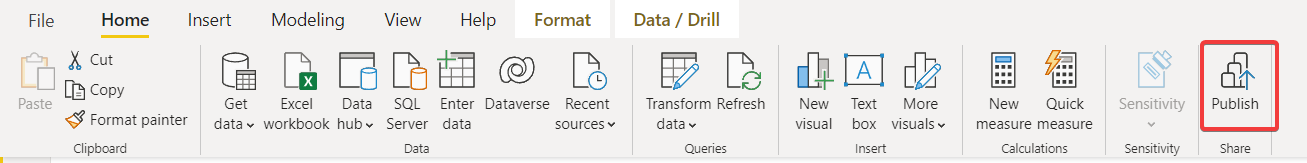
To publish, you need to click Publish and, if necessary, select a workspace.
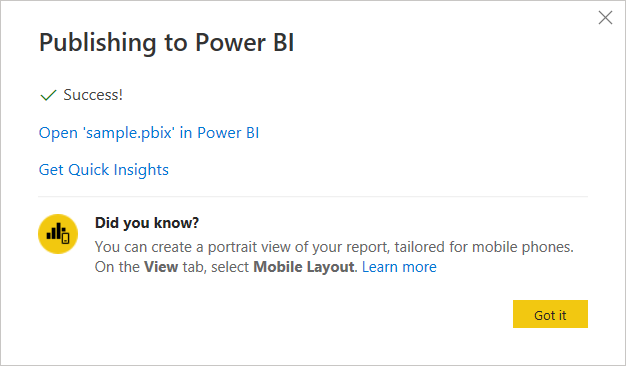
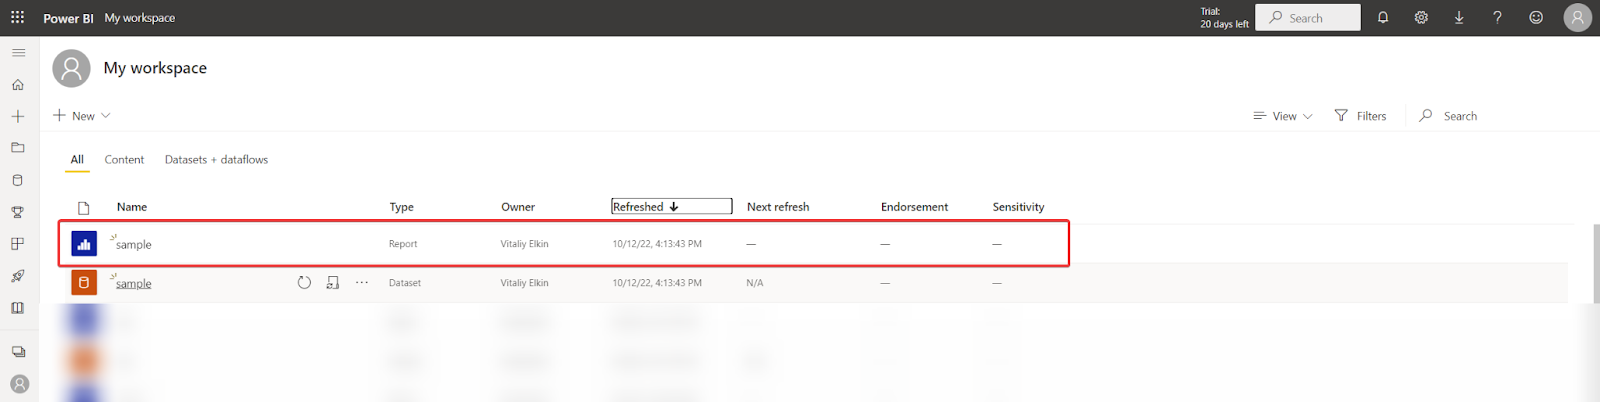
After successful publication, you should visit the portal and find our report.
Such a report can be adjusted, but restrictions will apply. They are mainly related to the fact that you cannot add new columns or measures. However, this does not prevent you from adding visualizations based on existing columns.
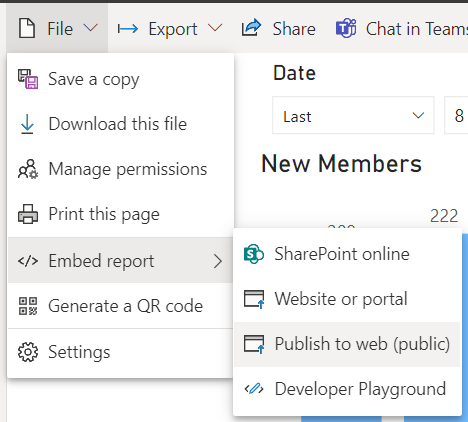
This report is only available to the Power BI users who you have given access to. In order to share your report with other people, you can Publish it to web (public).
Data Refresh
Since we haven't set up the Power BI Gateway, we won't have automatic refresh enabled. You can update the data only manually. To do that, you need to open the report, click on the button Refresh, and publish it again.

Tableau
Preliminary preparation.
You will need to get a driver to connect. We use Cloudera Hive. You can download it from the official website (registration is required). You need to know the OS and bit depth to choose the best suited version to download. Installation is simple (no explanation required).
Connection to cubes.
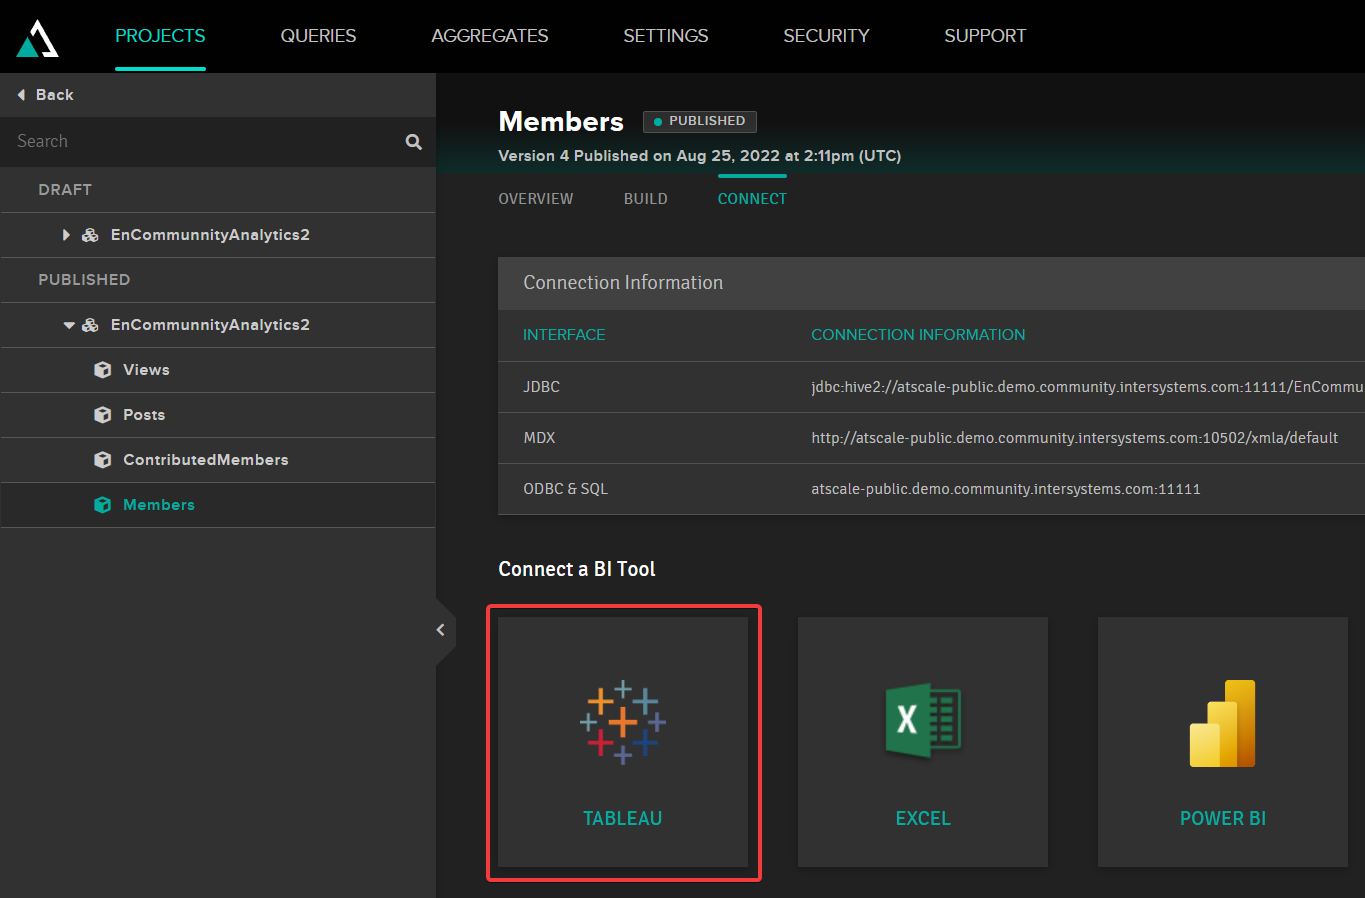
To connect a cube to a Tableau report, you should download the connection file. To do that, select the desired published project on the project page, then go to the connection tab and select the Tableau option.
In the window that appears, select DOWNLOAD TDS

When starting Tableau, on the menu to the left, select Connect, To a File, and More… from the list and open your .tds file which you downloaded earlier.
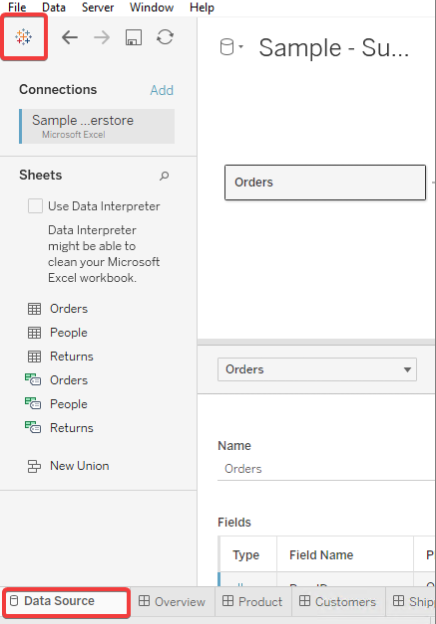
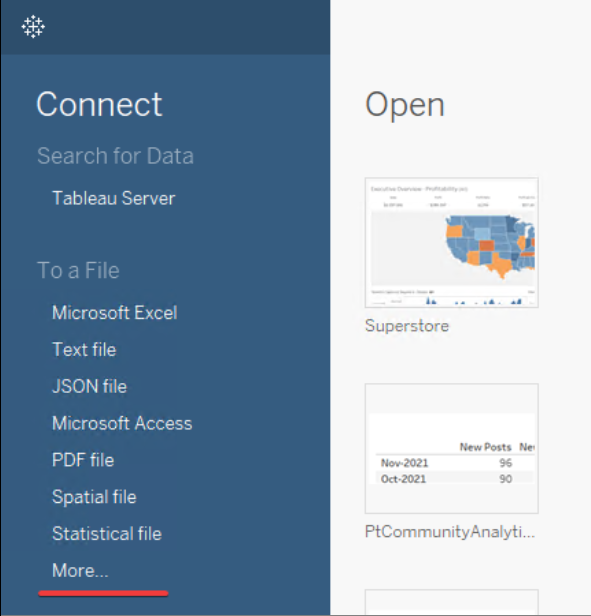
Tableau will ask you to enter your AtScale username and password. After successful authorization, your cube will appear in the data sources and allow you to start working.
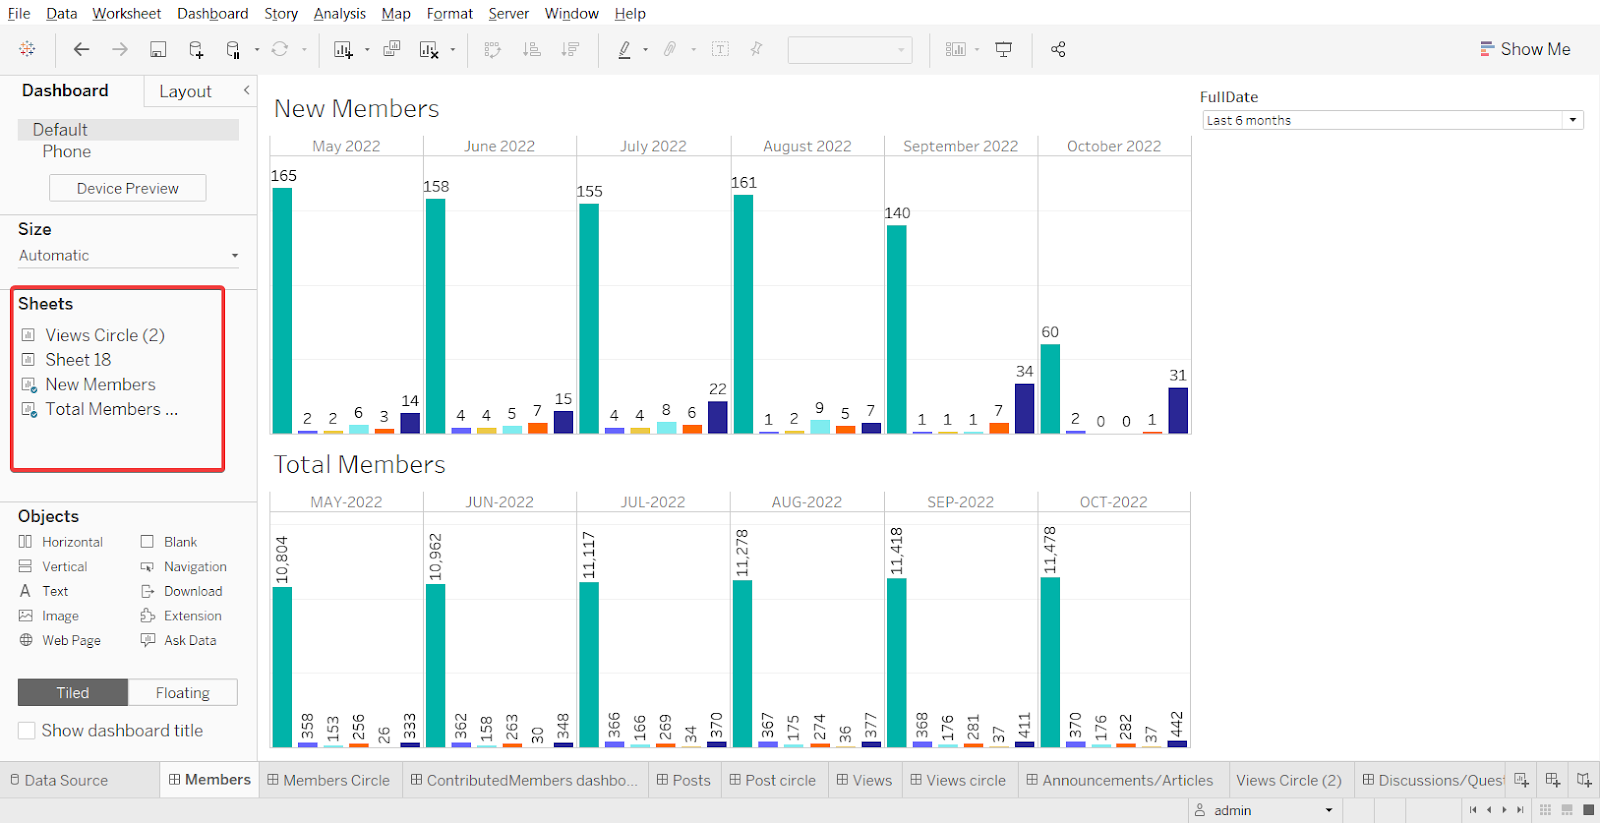
Creating visualizations.
Unlike Power BI, each visual is created on a separate page. However, you can later group them on the worksheet. Tableau has rows and columns, but the interface depends on where the dimensions and measures are located.
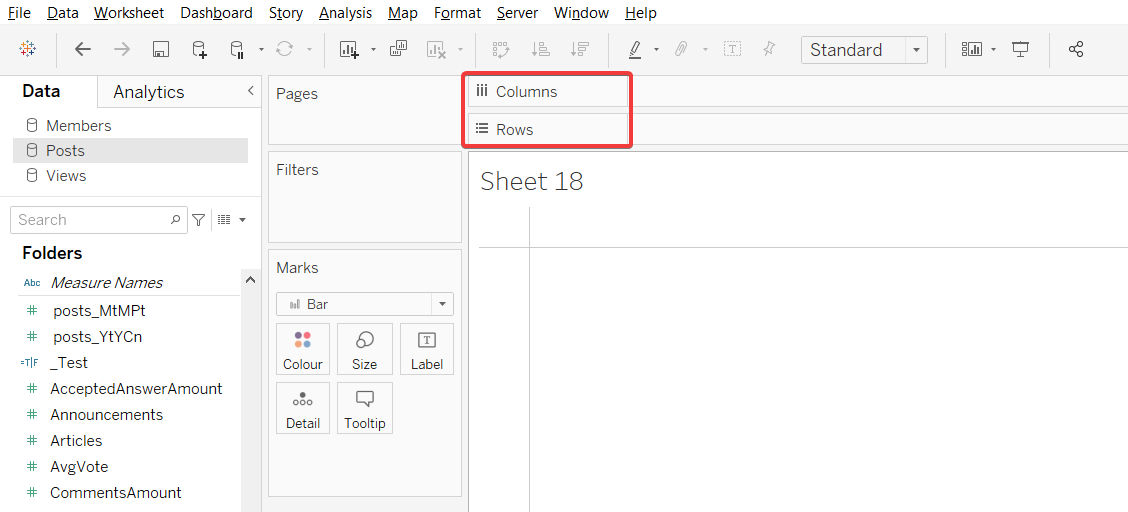


To select the type of visualization, you need to click on Show Me in the upper right corner of the screen (when you modify the type of visualization, the location of the selected values may change).

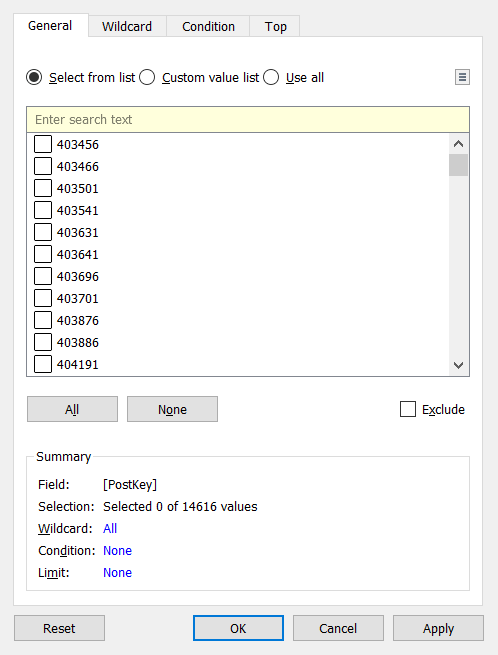
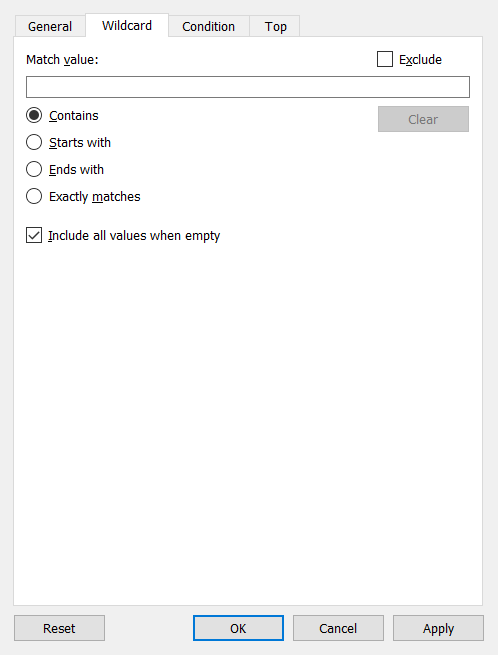
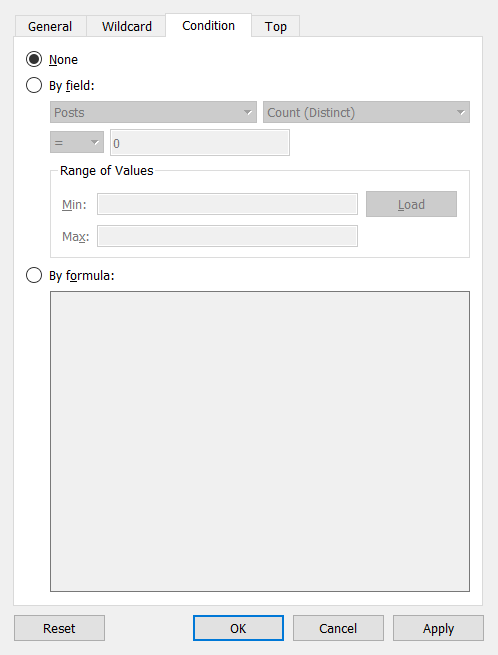
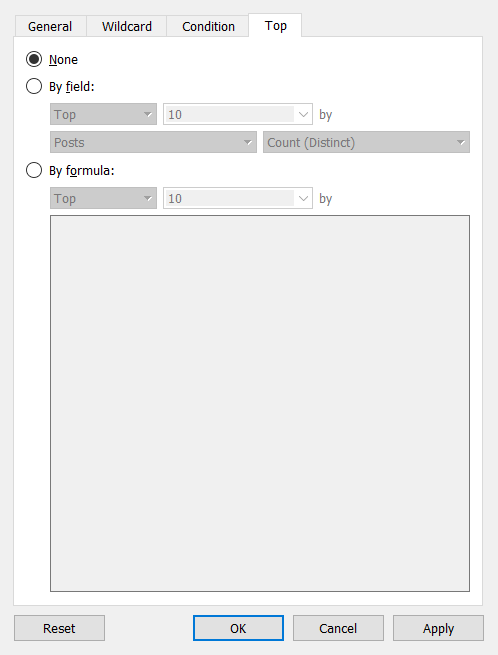
The field for filtering data by default is located on the card on the left.
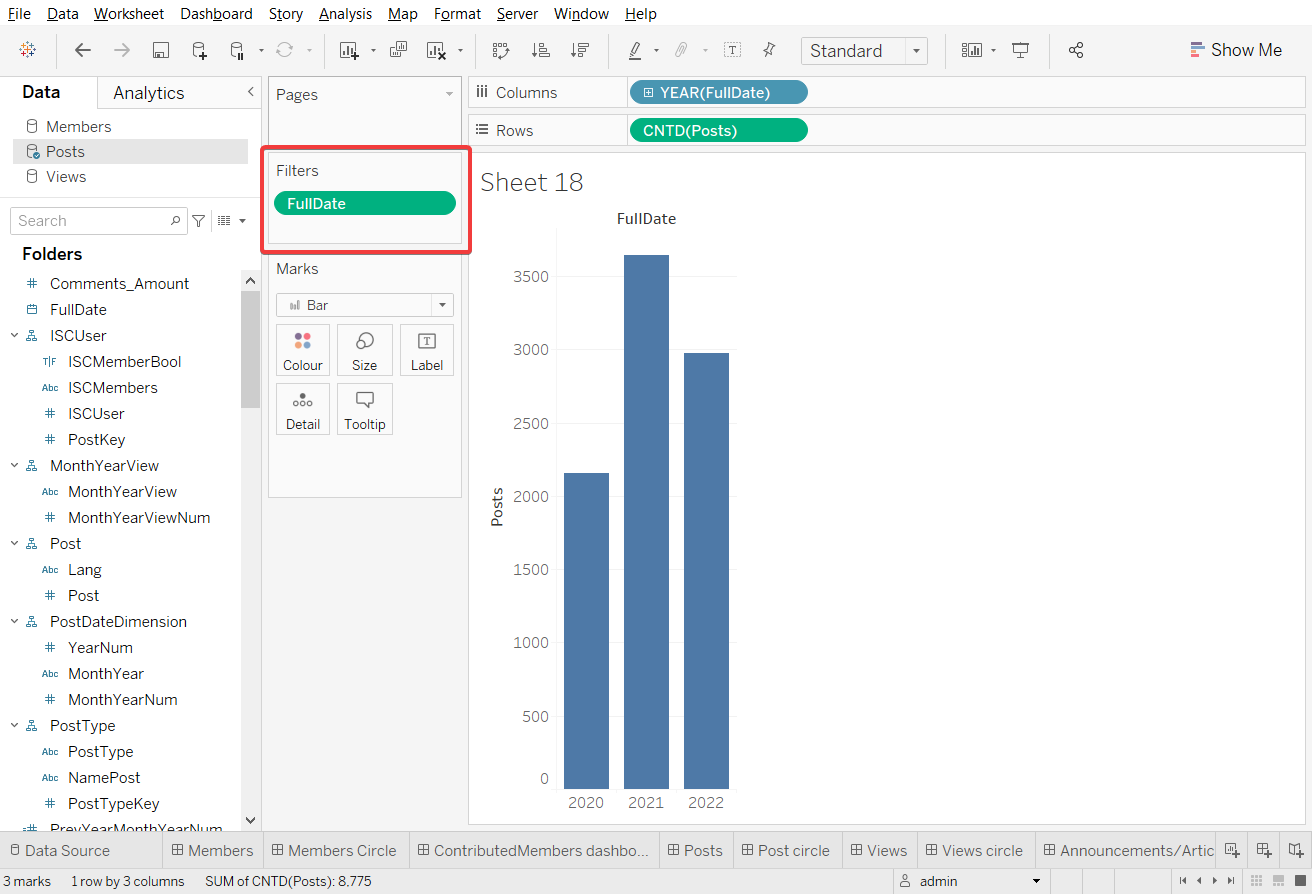
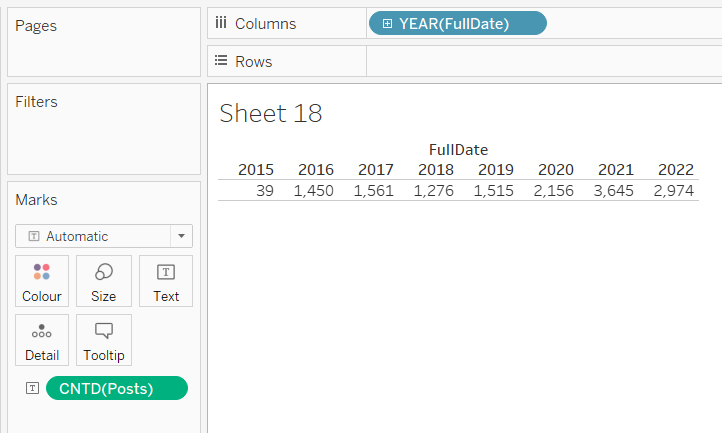
Values can be filtered manually, by Wildcard, Condition, or Top(Bottom). You can also combine these types of filtering.
You can alter the visualization format in the Marks.

A worksheet is used to group sheets. On the left, there is a list of all available sheets that can be dragged and grouped as you wish. Also, on Worksheets in the Objects card, you can select and add text, images, etc.
Publishing to the server.
In Tableau, you can publish your reports in Tableau Public, Tableau Online, and Tableau Server. The functionality of the last two programs is identical. The only difference is that Tableau Online is maintained by Tableau itself, while Tableau Server will be maintained on the side of your organization. You can publish your reports there with a Live connection, modify published reports without limiting functionality, or edit a published report in Tableau Desktop. The only disadvantage of servers is the inability to share your reports with someone who is not registered on the server. In other words, these reports are intended to be used exclusively within the organization. Tableau Public allows you to share your reports with those who have a link, but it does not let you use a direct data connection.
We will be connecting to Tableau Server.
First, we need to Sign in.
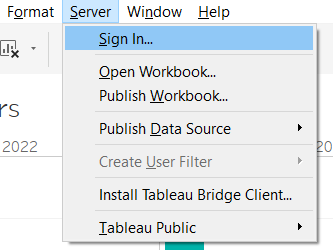
Select the desired server and go through authorization. Then select Publish Workbook.
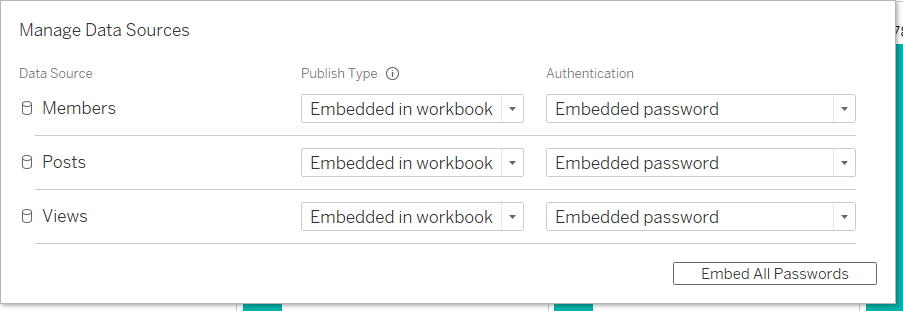
Specify the required parameters. For viewing convenience, we recommend selecting Show sheets as tabs.

If you wish, you can embed passwords. Otherwise, you will have to specify the login and password for our data source each time you get into your account. You can embed all passwords at once by clicking on the Embed All Passwords.
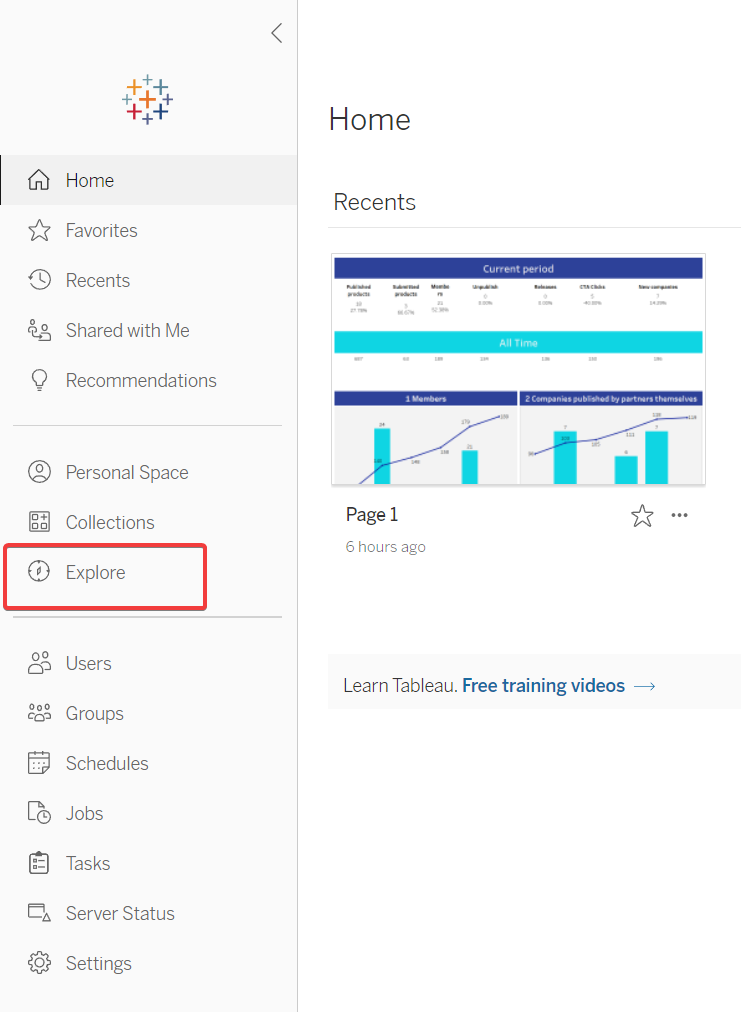
It is finally time to go to the server, select the Explore item, and find our book.