In this section, we will create a new namespace called “REPORTS,” where we will be compiling all the messages from other namespaces of interest to compute the message processing metrics.
1. From the main screen of the Management Portal, click System Administration à Configuration à System Configuration à Namespaces 2. To create a new namespace, click the Create New Namespace button on the top left corner of the page. 3. Fill in the following information to configure the namespace:This will launch the Database Wizard, which is used to create a new database
A warning will appear saying that the directory does not exist. This is okay.
This will launch the Database Wizard, which is used to create a new database
A warning will appear saying that the directory does not exist. This is okay.
To edit the settings of a namespace, click the namespace on the Namespaces page and edit the desired properties. Then click Save in the top left corner of the page.
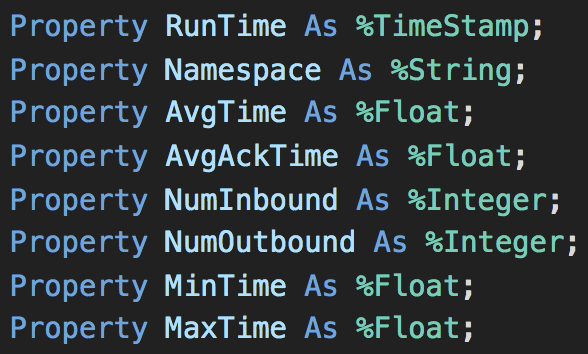
In this section, we will use Studio to code and create necessary class files to fetch messages from all namespaces specified in the ^ReportNamespaces global and store the computed metrics in the Demo.OperationalAnalytics.MetricsTable class.
1. Open Studio. Ensure you are in the REPORTS namespace. To switch namespaces, go to File à Change Namespace and select the REPORTS namespace. 2. Click File à New. Under Categories, select General. Under Templates, select Class Definition and click OK.
In this section, we will add the necessary global and package mappings to all namespaces that will be reporting to the REPORTS namespace.
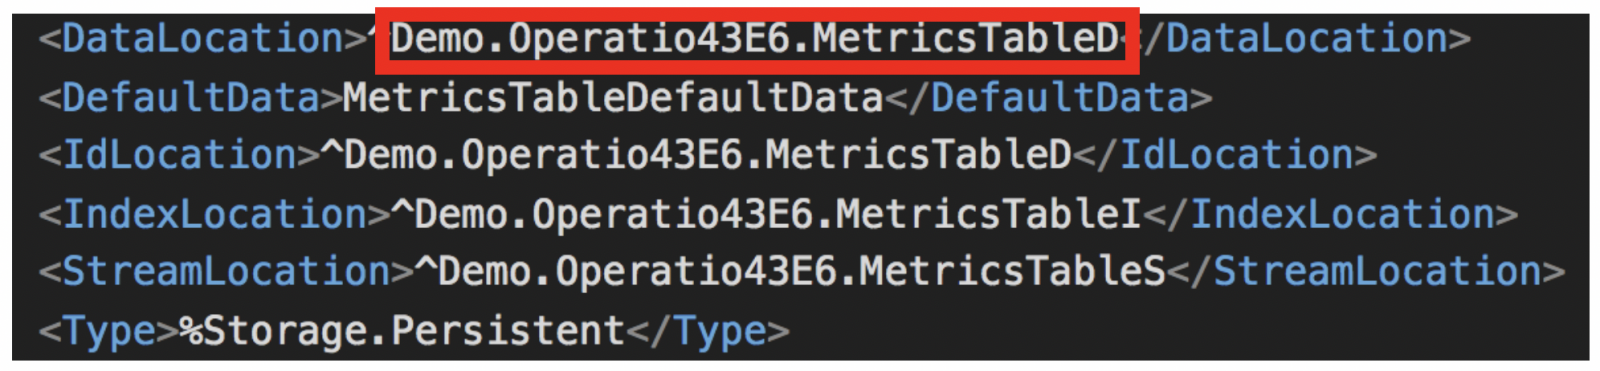
1. From the main screen of the Management Portal, click System Administration à Configuration à System Configuration à Namespaces 2. For every namespace you would like to include in the final table,<rect filled="f" id="Rectangle_x0020_3" o:gfxdata="UEsDBBQABgAIAAAAIQC75UiUBQEAAB4CAAATAAAAW0NvbnRlbnRfVHlwZXNdLnhtbKSRvU7DMBSF dyTewfKKEqcMCKEmHfgZgaE8wMW+SSwc27JvS/v23KTJgkoXFsu+P+c7Ol5vDoMTe0zZBl/LVVlJ gV4HY31Xy4/tS3EvRSbwBlzwWMsjZrlprq/W22PELHjb51r2RPFBqax7HCCXIaLnThvSAMTP1KkI +gs6VLdVdad08ISeCho1ZLN+whZ2jsTzgcsnJwldluLxNDiyagkxOquB2Knae/OLUsyEkjenmdzb mG/YhlRnCWPnb8C898bRJGtQvEOiVxjYhtLOxs8AySiT4JuDystlVV4WPeM6tK3VaILeDZxIOSsu ti/jidNGNZ3/J08yC1dNv9v8AAAA//8DAFBLAwQUAAYACAAAACEArTA/8cEAAAAyAQAACwAAAF9y ZWxzLy5yZWxzhI/NCsIwEITvgu8Q9m7TehCRpr2I4FX0AdZk2wbbJGTj39ubi6AgeJtl2G9m6vYx jeJGka13CqqiBEFOe2Ndr+B03C3WIDihMzh6RwqexNA281l9oBFTfuLBBhaZ4ljBkFLYSMl6oAm5 8IFcdjofJ0z5jL0MqC/Yk1yW5UrGTwY0X0yxNwri3lQgjs+Qk/+zfddZTVuvrxO59CNCmoj3vCwj MfaUFOjRhrPHaN4Wv0VV5OYgm1p+LW1eAAAA//8DAFBLAwQUAAYACAAAACEA5xR9ecYCAAB0BgAA HwAAAGNsaXBib2FyZC9kcmF3aW5ncy9kcmF3aW5nMS54bWysVV1P2zAUfZ+0/2D5HZK2pKUVBnXd Ok1CgAiIZ+M4TTTHzmy3pPv1u/5IGzHEpG19aH1zzz0+9yu9uOoagXZcm1pJgkenKUZcMlXUckPw 48P65BwjY6ksqFCSE7znBl9dfvxwQRcbTduqZggYpFlQgitr20WSGFbxhppT1XIJvlLphlow9SYp NH0B5kYk4zSdJg2tJb48Un2mlqKtrv+CSij2nRcrKnfUAKVgi+GTqFGwf2emC7n7qtu8vdNOObvZ 3WlUFwRD5SRtoEQ4iY4IAzN5FbU5EnSlbhxelSXqCB5P0uk8yzDaEzxN57PxLA18vLOIOcD5eDZ1 AAaI0Xx6nkUAq27/QMGqL++TgMwgBw4DiaZ1AuXu95wnfc73nMGQbARHk0P6Dt7n3oeaWLb/lPVB MF202tivXDXIHQjWIMiPFt1dGxtk9BCfjVrXQvhOCYleCM4m81nmI4wSdeG8Dmf05nklNNpRQfB6 ncLHJQgXD2BgCRkexvxsl/ui2e6TKvaO6Bl+YVK0AnEwKqZl6xqUXlNj76iG7YGHsIf2Fr5KoUCR iieMKqV/vvXc4WGiwYvRC2wjwebHlmqOkfgmDcHz0dkZ0FpvnGWzMRh66HkeeuS2WSnIcuTV+aPD W9EfS62aJ6WLpbsVXFQyuJtgZnVvrCzY4IKlZ3y59Gemmpbaa5m3sH4jX2LXiYfuieo2tsvCeN+o vKItf6trARv6ttxaVdaxpaGqziGMze1ecN9SX3suC1fZe6i6gNkkmMuTxzx2DxDQtWN7tobnrZvi 0Ny+f8ZRenp5z0vYc7eBYUrcW44fRoMyxqUN2ZmKFjxMTDYcmD7CXy0coWMuYdIO3JGgRwaSnjtI i3gXyssSFB+C0/eEheBDhL9ZyWNwU0ul3yIQkFW8OeDDoIfCuD1wpXz1vvWQ+P/gXupD+/IXAAAA //8DAFBLAwQUAAYACAAAACEAkS1qSVgGAAAPGgAAGgAAAGNsaXBib2FyZC90aGVtZS90aGVtZTEu eG1s7FlLbxs3EL4X6H9Y7L2x3oqNyIGtR9zEToJISZEjpaV2GXOXC5Kyo1uRnHopUCAtemiA3noo igZogAa99McYcNCmP6JD7kOkRMUPuEBQxAKM3dlvhsOZ2W9I7o2bT2PqHWEuCEs6fvVaxfdwMmEB ScKO/3A0+Oy67wmJkgBRluCOP8fCv7n96Sc30NaEknTMEA9GEY6xB4YSsYU6fiRlurWxISYgRuIa S3ECz6aMx0jCLQ83Ao6OYYCYbtQqldZGjEjib4NFqQz1KfxLpFCCCeVDZQZ7CYph9HvTKZlgjQ0O qwoh5qJLuXeEaMcHmwE7HuGn0vcoEhIedPyK/vM3tm9soK1cico1uobeQP/lerlCcFjTY/JwXA7a aDQbrZ3SvgZQuYrrt/utfqu0pwFoMoGZZr6YNpu7m7u9Zo41QNmlw3av3atXLbxhv77i805T/Sy8 BmX2Gyv4waALUbTwGpThmyv4RqNd6zYsvAZl+NYKvl3Z6TXaFl6DIkqSwxV0pdmqd4vZlpApo3tO +GazMWjXcuMLFFRDWV1qiClL5Lpai9ETxgcAUECKJEk8OU/xFE2gJruIkjEn3j4JIyi8FCVMgLhS qwwqdfivfg19pSOCtjAytJVf4IlYESl/PDHhJJUd/zZY9Q3I6Zs3J89enzz7/eT585Nnv+Zja1OW 3h5KQlPv3U/f/PPyS+/v33589+LbbOhlvDDxb3/56u0ff77PPMx4EYrT7169ff3q9Puv//r5hcP6 DkdjEz4iMRbeXXzsPWAxTNDhPx7zi2mMIkRMjZ0kFChBahSH/b6MLPTdOaLIgdvFdhwfcaAaF/DW 7Inl8DDiM0kcFu9EsQU8YIzuMu6Mwh01lhHm0SwJ3YPzmYl7gNCRa+wuSqws92cpcCxxmexG2HLz PkWJRCFOsPTUM3aIsWN2jwmx4npAJpwJNpXeY+LtIuIMyYiMrWpaKO2RGPIydzkI+bZic/DI22XU NesePrKR8G4g6nB+hKkVxltoJlHsMjlCMTUDvo9k5HJyOOcTE9cXEjIdYsq8foCFcOnc4zBfI+l3 gGbcaT+g89hGckkOXTb3EWMmsscOuxGKUxd2SJLIxH4uDqFEkXefSRf8gNlviLqHPKBkbbofEWyl +2w2eAgMa7q0KBD1ZMYdubyFmVW/wzmdIqypBhqAxesxSc4k+SV6b/539A4kevrDS8eMrobS3Yat fFyQzHc4cb5Ne0sUvg63TNxdxgPy4fN2D82S+xheldXm9ZG2P9K2/7+n7XXv89WT9YKfgbrVsjVb ruvFe7x27T4llA7lnOJ9oZfvArpSMACh0tN7VFzu5dIILtWbDANYuJAjreNxJr8gMhpGKIU1ftVX RkKRmw6FlzIBS38tdtpWeDqLD1iQbVmrVbU9zchDILmQV5qlHLYbMkO32ottWGleexvq7XLhgNK9 iBPGYLYTdYcT7UKogqQ35xA0hxN6ZlfixabDi+vKfJGqFS/AtTIrsGzyYLHV8ZsNUAEl2FUhigOV pyzVRXZ1Mq8y0+uCaVUArCGKClhkelP5unZ6anZZqZ0j05YTRrnZTujI6B4mIhTgvDqV9DxuXDTX m4uUWu6pUOjxoLQWbrSvv8+Ly+Ya9Ja5gSYmU9DEO+74rXoTSmaC0o4/ha0/XMYp1I5Qy11EQzg0 m0ievfCXYZaUC9lDIsoCrkknY4OYSMw9SuKOr6ZfpoEmmkO0b9UaEMIH69wm0MqH5hwk3U4ynk7x RJppNyQq0tktMHzGFc6nWv3yYKXJZpDuYRQce2M64w8QlFizXVUBDIiAE6BqFs2AwJFmSWSL+ltq TDntmmeKuoYyOaJphPKOYpJ5BtdUXrqj78oYGHf5nCGgRkjyRjgOVYM1g2p107JrZD6s7bpnK6nI GaS56JkWq6iu6WYxa4SiDSzF8nJN3vCqCDFwmtnhM+peptzNguuW1glll4CAl/FzdN1zNATDtcVg lmvK41UaVpydS+3eUUzwDNfO0yQM1m8VZpfiVvYI53AgvFTnB73lqgXRtFhX6ki7Pk8coNQbh9WO D58I4GziKVzBRwYfZDUlqykZXMGXA2gX2XF/x88vCgk8zyQlpl5I6gWmUUgahaRZSJqFpFVIWr6n z8XhW4w6Eve94tgbelh+TJ6vLexvONv/AgAA//8DAFBLAwQUAAYACAAAACEAnGZGQbsAAAAkAQAA KgAAAGNsaXBib2FyZC9kcmF3aW5ncy9fcmVscy9kcmF3aW5nMS54bWwucmVsc4SPzQrCMBCE74Lv EPZu0noQkSa9iNCr1AcIyTYtNj8kUezbG+hFQfCyMLPsN7NN+7IzeWJMk3ccaloBQae8npzhcOsv uyOQlKXTcvYOOSyYoBXbTXPFWeZylMYpJFIoLnEYcw4nxpIa0cpEfUBXNoOPVuYio2FBqrs0yPZV dWDxkwHii0k6zSF2ugbSL6Ek/2f7YZgUnr16WHT5RwTLpRcWoIwGMwdKV2edNS1dgYmGff0m3gAA AP//AwBQSwECLQAUAAYACAAAACEAu+VIlAUBAAAeAgAAEwAAAAAAAAAAAAAAAAAAAAAAW0NvbnRl bnRfVHlwZXNdLnhtbFBLAQItABQABgAIAAAAIQCtMD/xwQAAADIBAAALAAAAAAAAAAAAAAAAADYB AABfcmVscy8ucmVsc1BLAQItABQABgAIAAAAIQDnFH15xgIAAHQGAAAfAAAAAAAAAAAAAAAAACAC AABjbGlwYm9hcmQvZHJhd2luZ3MvZHJhd2luZzEueG1sUEsBAi0AFAAGAAgAAAAhAJEtaklYBgAA DxoAABoAAAAAAAAAAAAAAAAAIwUAAGNsaXBib2FyZC90aGVtZS90aGVtZTEueG1sUEsBAi0AFAAG AAgAAAAhAJxmRkG7AAAAJAEAACoAAAAAAAAAAAAAAAAAswsAAGNsaXBib2FyZC9kcmF3aW5ncy9f cmVscy9kcmF3aW5nMS54bWwucmVsc1BLBQYAAAAABQAFAGcBAAC2DAAAAAA= " strokecolor="red" strokeweight="4.25pt" style="position:absolute; left:0; text-align:left; margin-left:146px; margin-top:28px; width:222.7pt; height:15.5pt; z-index:251659264; v-text-anchor:middle"></rect>
In this section, we will build a Cube on Analytics Architect to organize the data from Demo.OperationalAnalytics.Compute class.
1. From the main screen of the Management Portal, click Analytics àArchitect. Ensure you are in the REPORTS namespace. 2. Click “New” and fill in the following information:

| Element Name | Year | Month | Day | Hour |
| Function | Year | MonthYear | DayMonthYear | HourNumber |
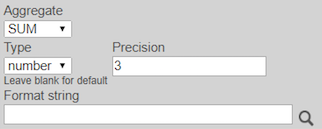
Under Details on the right-hand side, set the “Precision” to 3, as shown below.

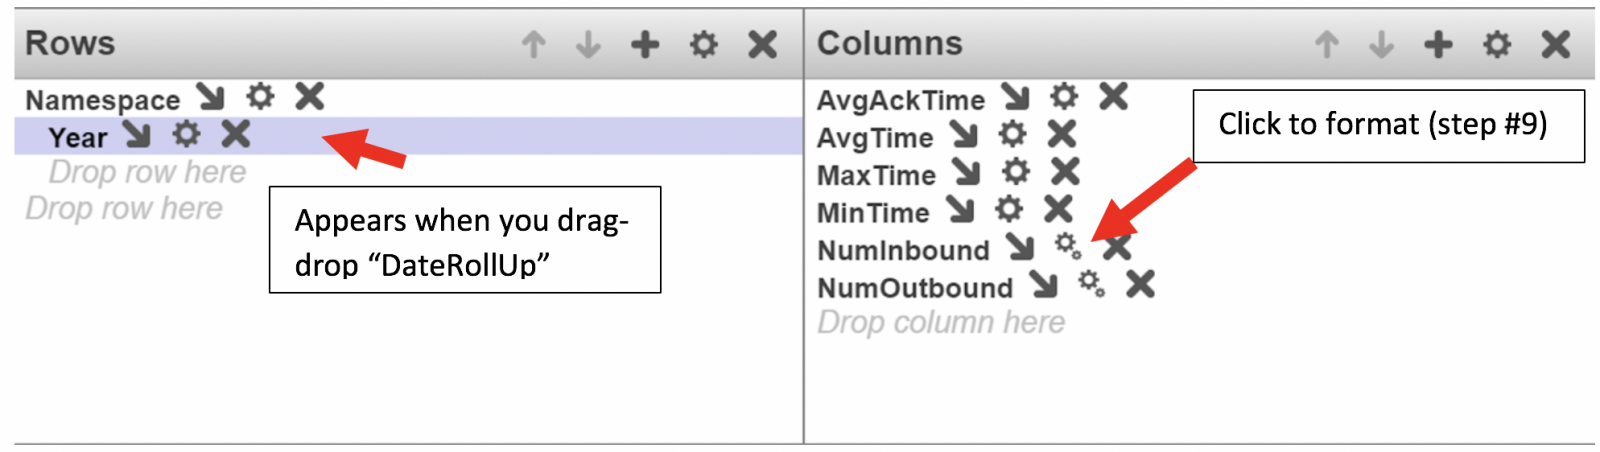
After dragging Namespace into Rows, drag DateRollUp onto the diagonal arrow of Namespace.
<shape id="Straight_x0020_Arrow_x0020_Connector_x0020_13" o:gfxdata="UEsDBBQABgAIAAAAIQC75UiUBQEAAB4CAAATAAAAW0NvbnRlbnRfVHlwZXNdLnhtbKSRvU7DMBSF dyTewfKKEqcMCKEmHfgZgaE8wMW+SSwc27JvS/v23KTJgkoXFsu+P+c7Ol5vDoMTe0zZBl/LVVlJ gV4HY31Xy4/tS3EvRSbwBlzwWMsjZrlprq/W22PELHjb51r2RPFBqax7HCCXIaLnThvSAMTP1KkI +gs6VLdVdad08ISeCho1ZLN+whZ2jsTzgcsnJwldluLxNDiyagkxOquB2Knae/OLUsyEkjenmdzb mG/YhlRnCWPnb8C898bRJGtQvEOiVxjYhtLOxs8AySiT4JuDystlVV4WPeM6tK3VaILeDZxIOSsu ti/jidNGNZ3/J08yC1dNv9v8AAAA//8DAFBLAwQUAAYACAAAACEArTA/8cEAAAAyAQAACwAAAF9y ZWxzLy5yZWxzhI/NCsIwEITvgu8Q9m7TehCRpr2I4FX0AdZk2wbbJGTj39ubi6AgeJtl2G9m6vYx jeJGka13CqqiBEFOe2Ndr+B03C3WIDihMzh6RwqexNA281l9oBFTfuLBBhaZ4ljBkFLYSMl6oAm5 8IFcdjofJ0z5jL0MqC/Yk1yW5UrGTwY0X0yxNwri3lQgjs+Qk/+zfddZTVuvrxO59CNCmoj3vCwj MfaUFOjRhrPHaN4Wv0VV5OYgm1p+LW1eAAAA//8DAFBLAwQUAAYACAAAACEAsyjlXvsBAADMBAAA HwAAAGNsaXBib2FyZC9kcmF3aW5ncy9kcmF3aW5nMS54bWykVNuO0zAQfUfiHyy/s8m2ZFuiTVeo bJcHxK4ofMDgOImFM45sk6Z/zzi3loqLYJ9iZ845c2Y89u1dV2vWSuuUwYxfX8WcSRQmV1hm/Mvn 3as1Z84D5qANyowfpeN3m5cvbiEtLTSVEowU0KWQ8cr7Jo0iJypZg7syjUSKFcbW4Glryyi3cCDl WkeLOL6JalDINyepd+CBfbfqP6S0Ed9kvgVswZGkFun5n9GjFs9XhhTbB9vsmycbnIuP7ZNlKs84 dQ6hphbxaAyMMNpGF6zyJNAVtg54UxSsy/hytVoky4SzY8YXi/VNHMeDnuw8EwGQrJKY4oIAr5N4 nYzpqse/CIjq/k8SZHGwQosze6LDfRP8YbsNy8uqr5dT2XtvQZWVZ2+tNQe2NYhSeGMZQaaOjBJT R84U3agcPLBCq+Y9TWM/G89qzFwVpI11/kGamoVFxt1od/Y5ZIP2g/ODv4kQqtfIDhlPlm9WSW/K Ga3yndI6BJ0tv261ZS3ojO92dGT9mVHun2AelL7HnPljQ1PirQIstQy9IaTG/jO1wfmjlkPiT7Kg +aKTHwz2t0vO6UAIif56ViF0oBVkbSbGg+VwLX9HHPGBKouCzu1fyDOjz2zwRK4VGvur7L6bLBcD fqh+qJraMY5ddHGPe9T47oTH4ny/+QEAAP//AwBQSwMEFAAGAAgAAAAhAJEtaklYBgAADxoAABoA AABjbGlwYm9hcmQvdGhlbWUvdGhlbWUxLnhtbOxZS28bNxC+F+h/WOy9sd6KjciBrUfcxE6CSEmR I6WldhlzlwuSsqNbkZx6KVAgLXpogN56KIoGaIAGvfTHGHDQpj+iQ+5DpETFD7hAUMQCjN3Zb4bD mdlvSO6Nm09j6h1hLghLOn71WsX3cDJhAUnCjv9wNPjsuu8JiZIAUZbgjj/Hwr+5/eknN9DWhJJ0 zBAPRhGOsQeGErGFOn4kZbq1sSEmIEbiGktxAs+mjMdIwi0PNwKOjmGAmG7UKpXWRoxI4m+DRakM 9Sn8S6RQggnlQ2UGewmKYfR70ymZYI0NDqsKIeaiS7l3hGjHB5sBOx7hp9L3KBISHnT8iv7zN7Zv bKCtXInKNbqG3kD/5Xq5QnBY02PycFwO2mg0G62d0r4GULmK67f7rX6rtKcBaDKBmWa+mDabu5u7 vWaONUDZpcN2r92rVy28Yb++4vNOU/0svAZl9hsr+MGgC1G08BqU4Zsr+EajXes2LLwGZfjWCr5d 2ek12hZegyJKksMVdKXZqneL2ZaQKaN7TvhmszFo13LjCxRUQ1ldaogpS+S6WovRE8YHAFBAiiRJ PDlP8RRNoCa7iJIxJ94+CSMovBQlTIC4UqsMKnX4r34NfaUjgrYwMrSVX+CJWBEpfzwx4SSVHf82 WPUNyOmbNyfPXp88+/3k+fOTZ7/mY2tTlt4eSkJT791P3/zz8kvv799+fPfi22zoZbww8W9/+ert H3++zzzMeBGK0+9evX396vT7r//6+YXD+g5HYxM+IjEW3l187D1gMUzQ4T8e84tpjCJETI2dJBQo QWoUh/2+jCz03TmiyIHbxXYcH3GgGhfw1uyJ5fAw4jNJHBbvRLEFPGCM7jLujMIdNZYR5tEsCd2D 85mJe4DQkWvsLkqsLPdnKXAscZnsRthy8z5FiUQhTrD01DN2iLFjdo8JseJ6QCacCTaV3mPi7SLi DMmIjK1qWijtkRjyMnc5CPm2YnPwyNtl1DXrHj6ykfBuIOpwfoSpFcZbaCZR7DI5QjE1A76PZORy cjjnExPXFxIyHWLKvH6AhXDp3OMwXyPpd4Bm3Gk/oPPYRnJJDl029xFjJrLHDrsRilMXdkiSyMR+ Lg6hRJF3n0kX/IDZb4i6hzygZG26HxFspftsNngIDGu6tCgQ9WTGHbm8hZlVv8M5nSKsqQYagMXr MUnOJPklem/+d/QOJHr6w0vHjK6G0t2GrXxckMx3OHG+TXtLFL4Ot0zcXcYD8uHzdg/NkvsYXpXV 5vWRtj/Stv+/p+117/PVk/WCn4G61bI1W67rxXu8du0+JZQO5ZzifaGX7wK6UjAAodLTe1Rc7uXS CC7VmwwDWLiQI63jcSa/IDIaRiiFNX7VV0ZCkZsOhZcyAUt/LXbaVng6iw9YkG1Zq1W1Pc3IQyC5 kFeapRy2GzJDt9qLbVhpXnsb6u1y4YDSvYgTxmC2E3WHE+1CqIKkN+cQNIcTemZX4sWmw4vrynyR qhUvwLUyK7Bs8mCx1fGbDVABJdhVIYoDlacs1UV2dTKvMtPrgmlVAKwhigpYZHpT+bp2emp2Wamd I9OWE0a52U7oyOgeJiIU4Lw6lfQ8blw015uLlFruqVDo8aC0Fm60r7/Pi8vmGvSWuYEmJlPQxDvu +K16E0pmgtKOP4WtP1zGKdSOUMtdREM4NJtInr3wl2GWlAvZQyLKAq5JJ2ODmEjMPUrijq+mX6aB JppDtG/VGhDCB+vcJtDKh+YcJN1OMp5O8USaaTckKtLZLTB8xhXOp1r98mClyWaQ7mEUHHtjOuMP EJRYs11VAQyIgBOgahbNgMCRZklki/pbakw57ZpnirqGMjmiaYTyjmKSeQbXVF66o+/KGBh3+Zwh oEZI8kY4DlWDNYNqddOya2Q+rO26ZyupyBmkueiZFquorulmMWuEog0sxfJyTd7wqggxcJrZ4TPq XqbczYLrltYJZZeAgJfxc3TdczQEw7XFYJZryuNVGlacnUvt3lFM8AzXztMkDNZvFWaX4lb2COdw ILxU5we95aoF0bRYV+pIuz5PHKDUG4fVjg+fCOBs4ilcwUcGH2Q1JaspGVzBlwNoF9lxf8fPLwoJ PM8kJaZeSOoFplFIGoWkWUiahaRVSFq+p8/F4VuMOhL3veLYG3pYfkyery3sbzjb/wIAAP//AwBQ SwMEFAAGAAgAAAAhAJxmRkG7AAAAJAEAACoAAABjbGlwYm9hcmQvZHJhd2luZ3MvX3JlbHMvZHJh d2luZzEueG1sLnJlbHOEj80KwjAQhO+C7xD2btJ6EJEmvYjQq9QHCMk2LTY/JFHs2xvoRUHwsjCz 7DezTfuyM3liTJN3HGpaAUGnvJ6c4XDrL7sjkJSl03L2DjksmKAV201zxVnmcpTGKSRSKC5xGHMO J8aSGtHKRH1AVzaDj1bmIqNhQaq7NMj2VXVg8ZMB4otJOs0hdroG0i+hJP9n+2GYFJ69elh0+UcE y6UXFqCMBjMHSldnnTUtXYGJhn39Jt4AAAD//wMAUEsBAi0AFAAGAAgAAAAhALvlSJQFAQAAHgIA ABMAAAAAAAAAAAAAAAAAAAAAAFtDb250ZW50X1R5cGVzXS54bWxQSwECLQAUAAYACAAAACEArTA/ 8cEAAAAyAQAACwAAAAAAAAAAAAAAAAA2AQAAX3JlbHMvLnJlbHNQSwECLQAUAAYACAAAACEAsyjl XvsBAADMBAAAHwAAAAAAAAAAAAAAAAAgAgAAY2xpcGJvYXJkL2RyYXdpbmdzL2RyYXdpbmcxLnht bFBLAQItABQABgAIAAAAIQCRLWpJWAYAAA8aAAAaAAAAAAAAAAAAAAAAAFgEAABjbGlwYm9hcmQv dGhlbWUvdGhlbWUxLnhtbFBLAQItABQABgAIAAAAIQCcZkZBuwAAACQBAAAqAAAAAAAAAAAAAAAA AOgKAABjbGlwYm9hcmQvZHJhd2luZ3MvX3JlbHMvZHJhd2luZzEueG1sLnJlbHNQSwUGAAAAAAUA BQBnAQAA6wsAAAAA " strokecolor="red" strokeweight="4.25pt" style="position:absolute; left:0; text-align:left; margin-left:300px; margin-top:145px; width:28.2pt; height:3.6pt; flip:x; z-index:251663360" type="#_x0000_t32"> <stroke endarrow="block" joinstyle="miter"> </stroke></shape>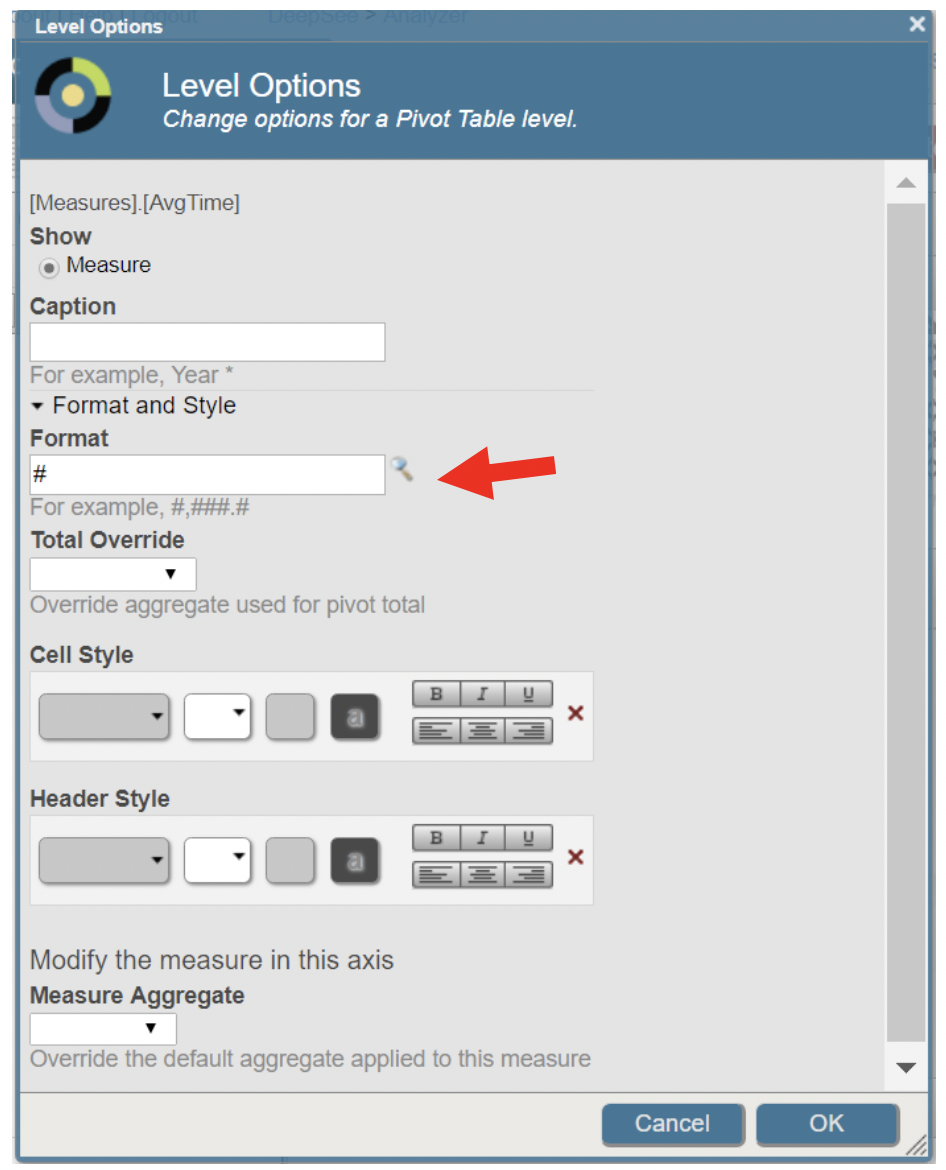
In this section, we will set up a dashboard on Analytics User Portal to display the resulting Operational Analytics pivot table.
1. From the main screen of the Management Portal, click Analytics à User Portal. Ensure you are in the REPORTS namespace. 2. Press the large “+” sign at the top, and then press “Add Dashboard” under “Add New Item” on the left-hand column.
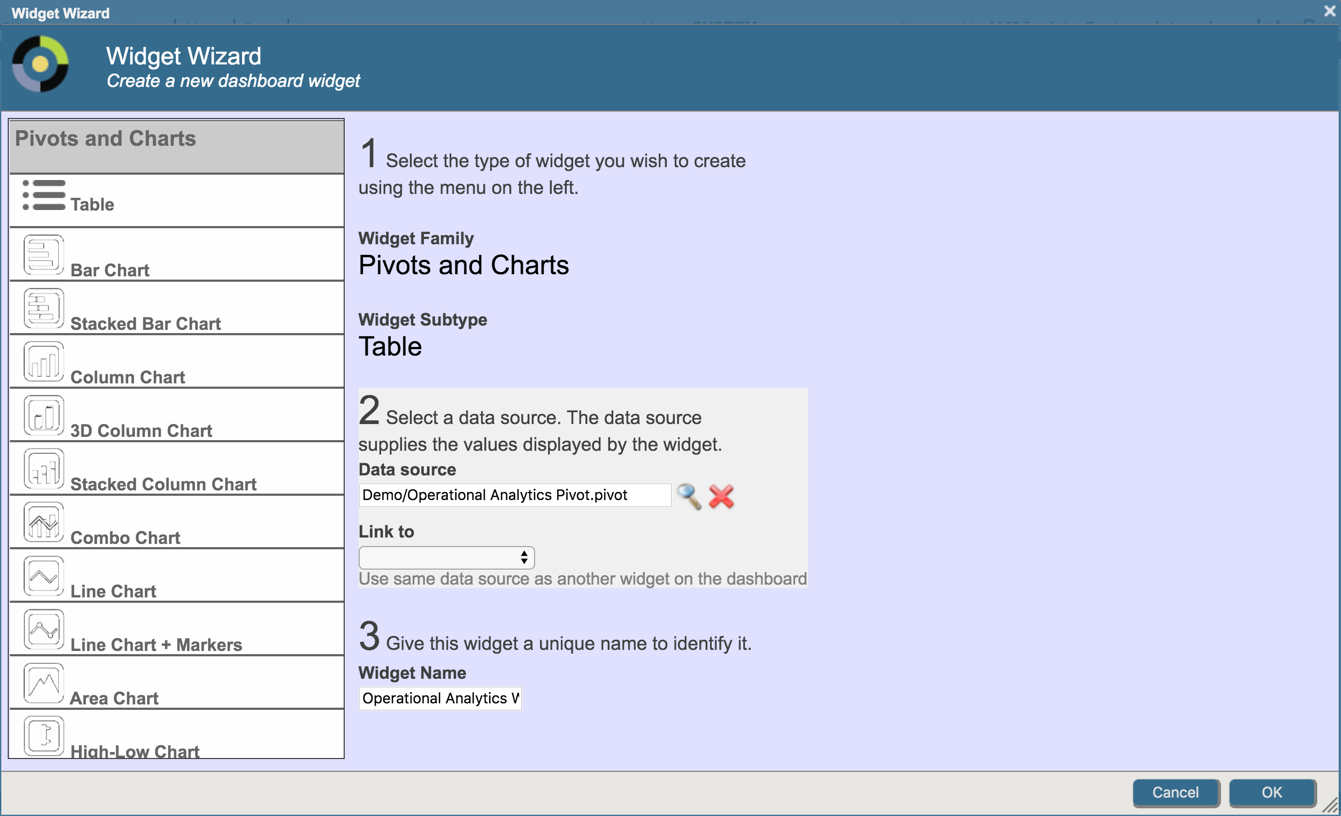
The resulting widget will display the data stored in the Demo.OperationalAnalytics.MetricsTable. As of right now, there is no data stored and you will see an empty table.
By adding a filter on Namespace or Year/Month/Day/Hour, we can focus on particular dates and exclude “null” data.
1. Click the right-hand arrow on the left-side of the page. In the Dashboard Editor that will slide out, click “Widgets” and then select the “Operational Analytics Widget” widget. 2. Click on “Controls” and then press the “+” sign to prompt the Control WizardIn this section, we will use the Task Manager to schedule the Operational Analytics Dashboard to refresh every hour to evaluate the messages from the preceding hour.
1. From the main screen of the Management Portal, ensure you are in the REPORTS namespace. To navigate to Task Manager, click System Operation à Task Manager à New Task 2. Fill out the Task Scheduler Wizard:In this section, we will examine how to verify the above implementation of the operational analytics table displaying key metrics of processing messages across specified namespaces.
To observe the contents of the Demo.OperationalAnalytics.MetricsTable, we can take advantage of the built-in SQL feature.
1. From the main screen of the Management Portal, ensure you are in the REPORTS namespace. 2. Navigate to System Explorer à SQL 3. Click “Execute Query” and insert the following SQL statement:By following the above implementation, we are able to achieve a table listing the metrics for messages from specified namespace(s).

*Please note that the data has been generated for display purposes.
Double click on "2019" next to SANDBOX to take advantage of the DateRollUp we created!  Continue clicking down into "Mar-2019" or any of the other months to drill down into days and then hours. ... and that's it! Please feel free to adapt the sample code to meet the needs of your organization! If you have any questions, please reach out to your account's Sales Engineer!