InterSystems for dummies – Machine learning

As we all know, InterSystems is a great company.
Their products can be just as useful as they are complex.
Yet, our pride sometimes prevents us from admitting that we might not understand some concepts or products that InterSystems offers for us.
Today we are beginning a series of articles explaining how some of the intricate InterSystems products work, obviously simply and clearly.
In this essay, I will clarify what Machine Learning is and how to take advantage of it.... because this time, you WILL KNOW for sure what I am talking about.
What (the hell) is Machine Learning?
Machine Learning is a branch of artificial intelligence that focuses on developing algorithms and models that enable computers to learn to perform specific tasks based on data, without being explicitly programmed for each task. Instead of following specific instructions, machines learn through experience, identifying patterns in data and making predictions or decisions based on them.
The process involves feeding algorithms with datasets (called training sets) to make them learn and improve their performance over time. Those algorithms can be designed to perform a wide range of tasks, including image recognition, natural language processing, financial trend prediction, medical diagnosis, and much more.
In summary, Machine Learning allows computers to learn from data and improve with experience, enabling them to perform complex tasks without explicit programming for each situation autonomously...
It is a lovely definition. Yet, I guess you need an example, so here we go:
Well, imagine that every day you write down somewhere the time of sunrise and sunset. If somebody asked you whether the sun would rise the next day, what would you say? All you have noticed was only the time of sunrise and sunset..
By observing your data, you would conclude that with 100% probability, the sun will rise tomorrow. However, you cannot ignore the fact that there is a chance that, due to a natural catastrophe, you will not be able to see the sun rising the next day. That is why you should say that the likelihood of witnessing a sunrise the following day is, in fact, 99.99%.
Considering your personal experience, you can provide an answer that matches your data. Machine Learning is the same thing but done by a computer..
Look at the table below:
| A | B |
| 1 | 2 |
| 2 | 4 |
| 3 | 6 |
| 4 | 8 |
How do columns A and B relate to each other?
The answer is easy, the value of B is double the A. B=A*2, is a pattern.
Now, examine the other table:
| A | B |
| 1 | 5 |
| 2 | 7 |
| 3 | 9 |
| 4 | 11 |
This one is a bit more complicated…. If you haven't uncovered the pattern, it is B=(A*2) +3.
A human, for instance, can deduce the formula, meaning that the more data you have, the easier it is to guess the pattern behind this mystery.
So, Machine Learning uses the same logic to reveal the pattern hidden in the data.
How to start?
First, you will need a computer, Yes, since this article is about Machine Learning, having only a notebook and a pencil will not be enough.
Second, you will require an instance of IRIS Community. You can download a Docker image and execute your test here. Note, that it must have ML integrated, e.g., the latest version of InterSystems IRIS Community:
docker pull intersystems/iris-ml-community:latest-emor
docker pull intersystems/iris-community:latestIf you need another platform, check https://hub.docker.com/r/intersystems/iris-ml-community/tags or https://hub.docker.com/r/intersystems/iris-community/tags.
Then, create a container from this container and run it:
docker run --name iris-ml -d --publish 1972:1972 --publish 52773:52773 intersystems/iris-m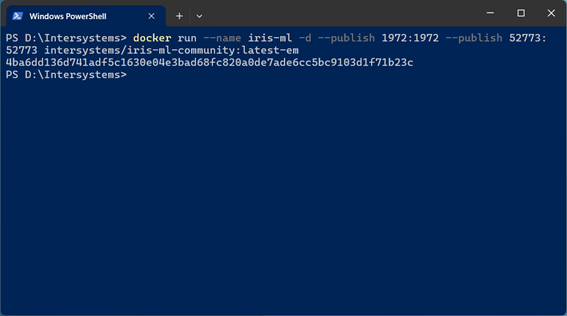
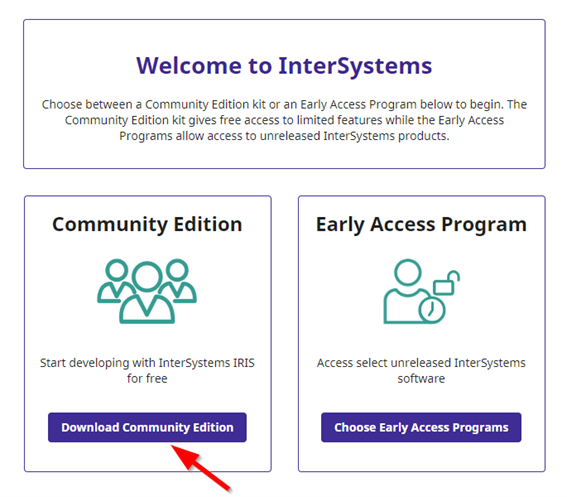
If you are "old-school", you can download a free version for evaluation. Yet, it is important to have an InterSystems account. Check it out at https://login.intersystems.com/login/SSO.UI.Register.cls.
Afterward, ask for an evaluation copy at https://evaluation.intersystems.com/Eval/.
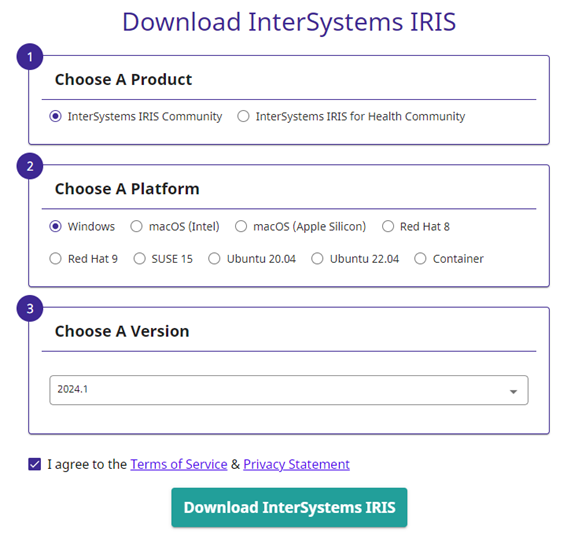
Install it and run your instance.
Now, access the IRIS portal. http://localhost:52773/csp/user/EnsPortal.ProductionConfig.zen
- User: Superuser
- Pass: SYS
Note: You might be asked to change the password the first time. Do not be afraid, just come up with a password that you can easily remember.
Open the "Machine learning configuration" to review the versions you installed.
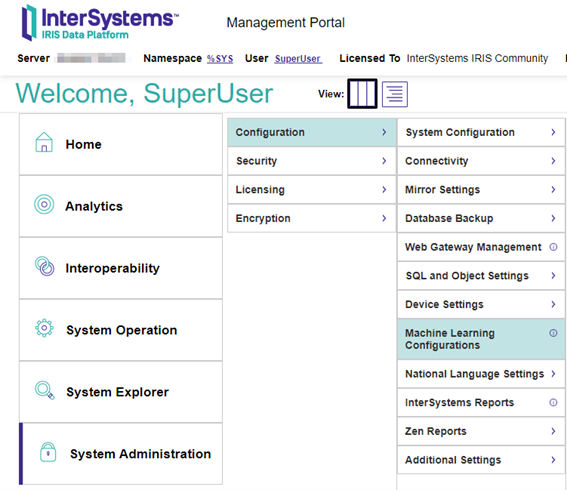
At this point, you can see the provider configurations of ML installed.
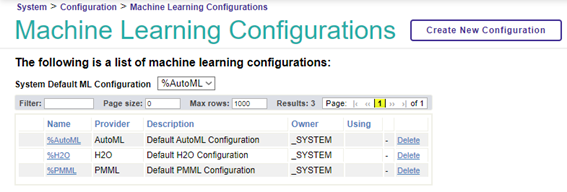
Earth, "water" and fire... what is the best?
All of them are good. The important thing is how to train your dragon, I mean... your data.
Explore more info about the existing models:
AutoML: AutoML is an automated Machine Learning system developed by InterSystems and housed within the InterSystems IRIS® data platform. It is designed to build accurate predictive models quickly using your data. It automates several key components of the machine-learning process.
Click the link below to see more info: https://docs.intersystems.com/iris20241/csp/docbook/Doc.View.cls?KEY=GAUTOML_Intro
H2O: It is an open-source Machine Learning model. The H2O provider does not support the creation of time series models.
Follow the link below to discover more: https://docs.intersystems.com/irislatest/csp/docbook/DocBook.UI.Page.cls?KEY=GIML_Configuration_Providers#GIML_Configuration_Providers_H2O
PMML: (Predictive Modelling Markup Language). It is an XML-based standard that expresses analytics models. It provides a way for applications to define statistical and data mining models so that they can be easily reused and shared.
Check out the link below for more info: https://docs.intersystems.com/irislatest/csp/docbook/DocBook.UI.Page.cls?KEY=APMML
What is the first step?
Just like in the sunset and sunrise example, we need some data to train our model.
It is essential to know the data objective and the values that should be predicted. It is also critical to have clear data without any duplicates. You must find out what the minimum set of data is as well.
I am going to use the AutoML provider because it is from Intersystems, ha-ha 😉
There are a few kinds of algorithms:
Decision trees: First, the information is classified, then the next question is applied to evaluate the probability. Example: Will it rain tomorrow? Check if the sky is cloudy (very or slightly) or clear. If it is very cloudy, then check the humidity. After that, check the temperature... If it is very cloudy, with high humidity and low temperature, then it will rain tomorrow..
Random forests: It is a set of decision trees, each of which "votes" for a class. The majority of the votes define the selected model.
Neural networks: It does not mean that Skynet is coming... However, it is too complicated to explain in just a few words. The general idea is to "copy" the function of human neurons. It means that each input data gets analyzed by a "neuron", which, in turn, provides the input data to the next "neuron" to analyze the output data.
If you wish to play around with neural networks using Python, you can create one and check how it works. Please, have a look at https://colab.research.google.com/drive/1XJ-Lph5auvoK1M4kcHZvkikOqZlmbytI?usp=sharing.
Through the link above, you can run a routine in Python, with the help of the TensorFlow library. To get the pattern of tables A and B do the following:
import tensorflow as tf
import numpy as np

tableA = np.array([1, 2, 3, 4, 5, 6, 7], dtype=float)
tableB = np.array([5, 7, 9, 11, 13, 15, 17], dtype=float)

hidden1 = tf.keras.layers.Dense(units=3, input_shape=[1])
hidden2 = tf.keras.layers.Dense(units=3)
exit = tf.keras.layers.Dense(units=1)
model = tf.keras.Sequential([hidden1, hidden2, exit])

model.compile(
    optimizer=tf.keras.optimizers.Adam(0.1),
    loss='mean_squared_error'
)

print("Start training...")
history = model.fit(tableA, tableB, epochs=1000, verbose=False)
print("Model trained!")

import matplotlib.pyplot as plt
plt.xlabel("# Epoch")
plt.ylabel("Loss magnitud")
plt.plot(history.history["loss"])

print("Doing a predicction!")
result = model.predict([100])
print("The result is " + str(result) )

print("Internal variables of the model")
print(hidden1.get_weights())
print(hidden2.get_weights())
print(exit.get_weights())
The code above utilizes the values of A and B to create a model to compare and discover the relation between both values.
When I have done the prediction, it retrieves the correct value, in this sample the prediction is 203.
How does it work in IRIS?
Machine Learning in IRIS is called “integratedML”. It has been implemented since InterSystems IRIS 2023.2 as an Experimental Feature, meaning that it is not supported for production environments. However, the feature is well-tested, and InterSystems believes it can add significant value to customers. You can find more information in Using integratedML documentation.
Still, since this is an ML lesson for beginners, I will explain how to operate it as simply as possible.
Note: I am utilizing a docker with an image from containers.intersystems.com/iris-ml-community
docker pull containers.intersystems.com/iris-ml-communityYou can download the IRIS image and samples from https://github.com/KurroLopez/iris-mll-fordummies.
docker-compose exec iris iris session irisSleepland University studio
Sleepland University has done extensive research on insomnia, conducting thousands of interviews and building a database with various parameters of patients with and without sleeplessness.
The collected data includes the following:
- Gender (male/female)
- Age (The age of the person in years)
- Occupation (The occupation or profession of the person)
- Sleep Duration (The number of hours the person sleeps per day)
- Quality of Sleep (A subjective rating of the quality of sleep, ranging from 1 to 10)
- Physical Activity Level (The number of minutes the person engages in physical activity daily)
- Stress Level (A subjective rating of the stress level experienced by the person, ranging from 1 to 10)
- BMI Category (The BMI category of the person: Underweight, Normal, Overweight)
- Systolic (Systolic blood pressure)
- Diastolic (Diastolic blood pressure)
- Heart Rate (The resting heart rate of the person in BPM)
- Daily Steps (The number of steps the person takes per day)
- Sleep Disorder (None, Insomnia, Sleep Apnea)
For the first sample, I created a class (St.MLL.insomniaBase) with the columns mentioned above:
Class St.MLL.insonmniaBase Extends %Persistent
{

/// Gender of patient (male/female)
Property Gender As %String;
/// The age of the person in years
Property Age As %Integer;
/// The occupation or profession of the person
Property Occupation As %String;
/// The number of hours the person sleeps per day
Property SleepDuration As %Numeric(SCALE = 2);
/// A subjective rating of the quality of sleep, ranging from 1 to 10
Property QualitySleep As %Integer;
/// The number of minutes the person engages in physical activity daily
Property PhysicalActivityLevel As %Integer;
/// A subjective rating of the stress level experienced by the person, ranging from 1 to 10
Property StressLevel As %Integer;
/// The BMI category of the person: Underweight, Normal, Overweight
Property BMICategory As %String;
/// Systolic blood pressure
Property Systolic As %Integer;
/// Diastolic blood pressure
Property Diastolic As %Integer;
/// The resting heart rate of the person in BPM
Property HeartRate As %Integer;
/// The number of steps the person takes per day
Property DailySteps As %Integer;
/// None, Insomnia, Sleep Apnea
Property SleepDisorder As %String;
}
Then, I built some classes extending from insomniaBase called insomnia01, insomniaValidate01, and insomniaTest01. It allowed me to have the same columns for each table.
Eventually, we will need to populate our tables with sample values, so I designed a class method for that purpose.
Class St.MLL.insomnia01 Extends St.MLL.insomniaBase
{

/// Populate values
ClassMethod Populate() As %Status
{
    write "Init populate "_$CLASSNAME(),!
    &sql(TRUNCATE TABLE St_MLL.insomnia01)
……
    write $CLASSNAME()_" populated",!
    Return $$$OK
}
docker-compose exec iris iris session irisUsing the terminal, call the method Populate of this class
Do ##class(St.MLL.insomnia01).Populate()If we do everything right, we will have a table with the values for training our ML.
We also need to create a new table for validation. It is easy because you will only require a part of the data provided for the training. In this case, it will be 50% of the items.
Please, run the following sentence in the terminal.
Do ##class(St.MLL.insomniaValidate01).Populate()Finally, we will prepare some test data to see the results of our training.
Do ##class(St.MLL.insomniaTest01).Populate()Train, train, and train... you will become stronger
Now, we have all the data needed to train our model. How to do it?
You will only need 4 simple instructions:
CREATE MODELTRAIN MODELVALIDATE MODELSELECT PREDICT
Creating the model
CREATE MODEL creates the Machine Learning model metadata by specifying the model’s name, the target field to be predicted, and the dataset that will supply the target field.
In our sample, we have some parameters to evaluate sleep disorders so we will design the following models:
- insomnia01SleepModel: By gender, age, sleep duration and quality of sleep.
- Check if the age and sleeping habits affect any sleep disorder type.
- insomnia01BMIModel: By gender, age, occupation and BMI category.
- Examine whether age, occupation and BMI affect any sleep disorder type.
- insomnia01AllModel: All factors
- Inspect if all factors affect any sleep disorder type..
We are going to create all those models now.
Using SQL management in IRIS portal, type the following sentence:
CREATE MODEL insomnia01AllModel PREDICTING (SleepDisorder) From St_MLL.insomnia01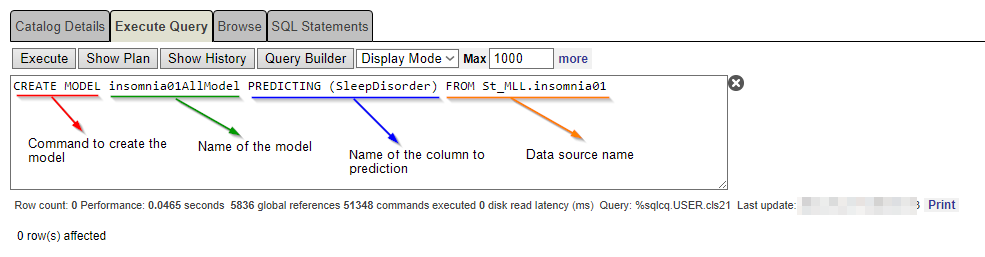
At this point, our model knows which column to predict.
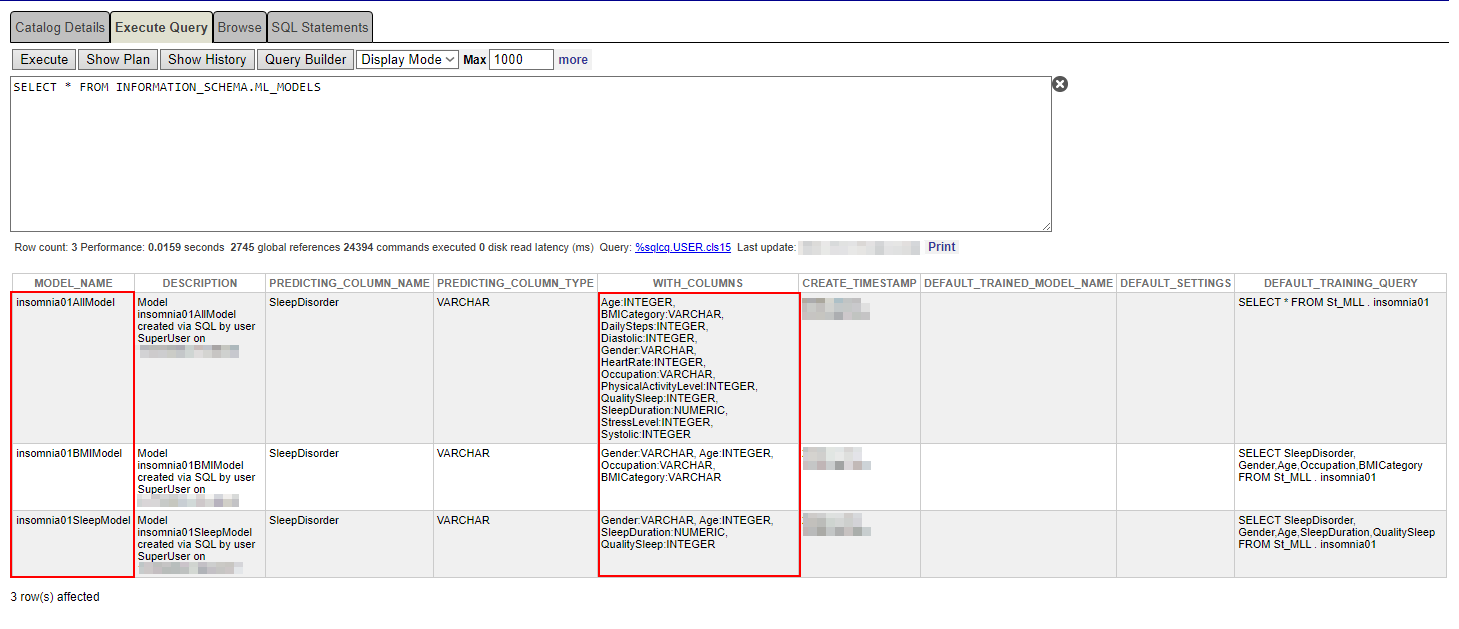
You can check what was created and what the predicting column contains with the sentence below:
SELECT * FROM INFORMATION_SCHEMA.ML_MODELS 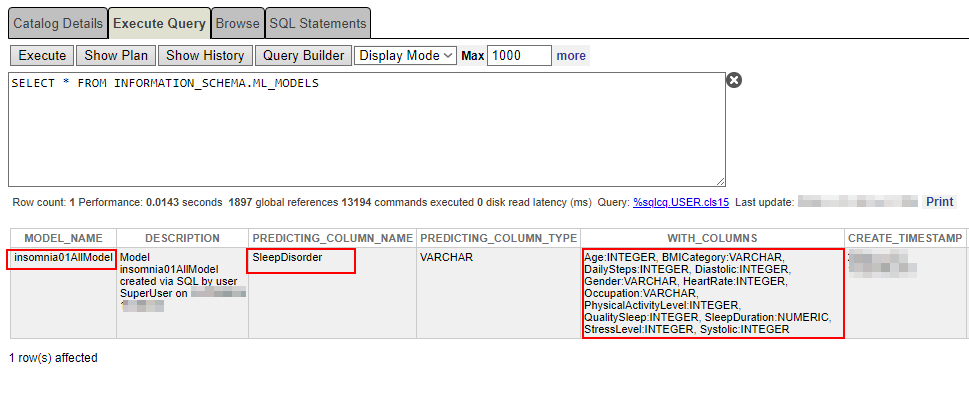
Ensure that the predicting column name and the columns themselves are correct.
However, we also want to add different model types since we wish to predict sleep disorders according to other factors, not all fields.
In this case, we are going to use the "WITH" clause to specify the columns that should be used as parameters to make the prediction.
To utilize the "WITH" clause, we must indicate the name of the columns and their type.
CREATE MODEL insomnia01SleepModel PREDICTING (SleepDisorder) WITH(Gender varchar, Age integer, SleepDuration numeric, QualitySleep integer) FROM St_MLL.insomnia01CREATE MODEL insomnia01BMIModel PREDICTING (SleepDisorder) WITH(Gender varchar, Age integer, Occupation varchar, BMICategory varchar) FROM St_MLL.insomnia01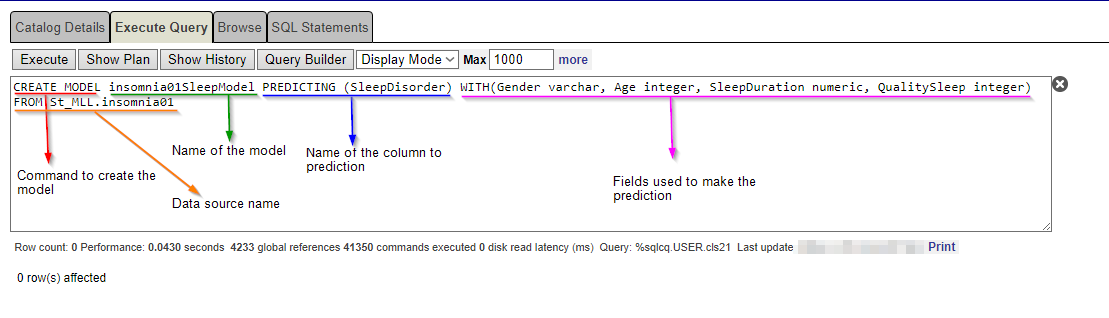 Make sure that all those models have been successfully created.
 Training the model
The TRAIN MODEL command runs the AutoML engine and specifies the data that will be used for training. FROM syntax is generic and allows the same model to be trained multiple times on various data sets. For instance, you may train a table with data from Sleepland University or Napcity University. The most important thing though is to have the data model with the same fields, same name, and the same type.
The AutoML engine automatically performs all necessary machine-learning tasks. It identifies relevant candidate features from the selected data, evaluates feasible model types based on the data and problem definition, and sets hyperparameters to create one or more viable models.
Since our model has 50 records, it is enough for such training.
TRAIN MODEL insomnia01AllModel FROM St_MLL.insomnia01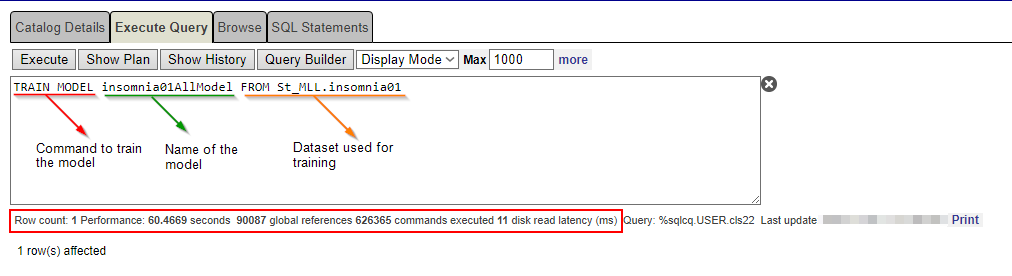
Do the same with other models.
TRAIN MODEL insomnia01SleepModel FROM St_MLL.insomnia01
TRAIN MODEL insomnia01BMIModel FROM St_MLL.insomnia01
You can find out whether your model has been properly trained with the following sentence:
SELECT * FROM INFORMATION_SCHEMA.ML_TRAINED_MODELS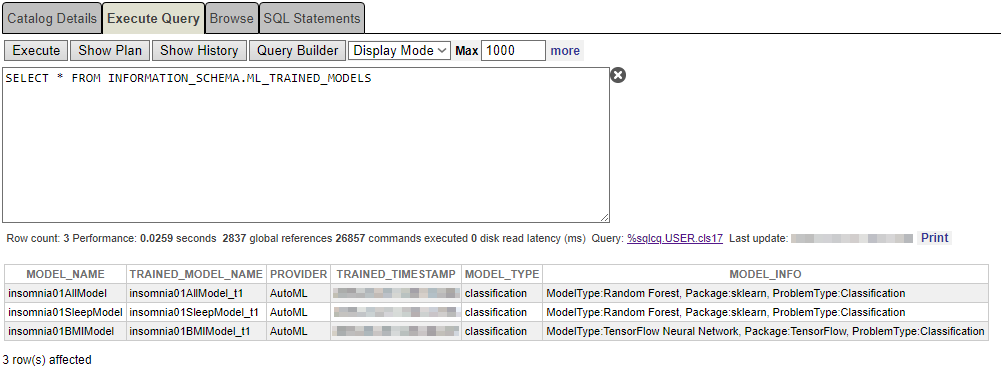
It is necessary to validate the model and the training with the command VALIDATE MODEL.
Validating the model
At this stage, we need to confirm that the model has been trained properly. So, we should run the command VALIDATE MODEL.
VALIDATE MODEL returns simple metrics for regression, classification, and time series models based on the provided testing set.
Check what has been validated with the sentence below:
VALIDATE MODEL insomnia01AllModel From St_MLL.insomniaValidate01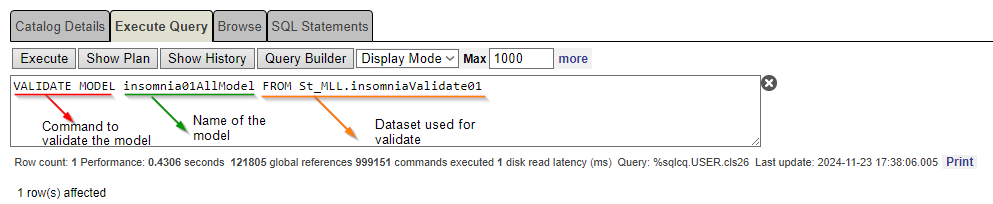
Repeat it with other models.
VALIDATE MODEL insomnia01SleepModel FROM St_MLL.insomniaValidate01
VALIDATE MODEL insomnia01BMIModel FROM St_MLL.insomniaValidate01
Consuming the model
Now, we will consume this model and inspect whether the model has been learning accurately how to produce the Result value.
With the help of the sentence “SELECT PREDICT”, we are going to forecast what the value of the Result will be. To do that, we will use the test1 table populated before.
SELECT *, PREDICT(insomnia01AllModel) FROM St_MLL.insomniaTest01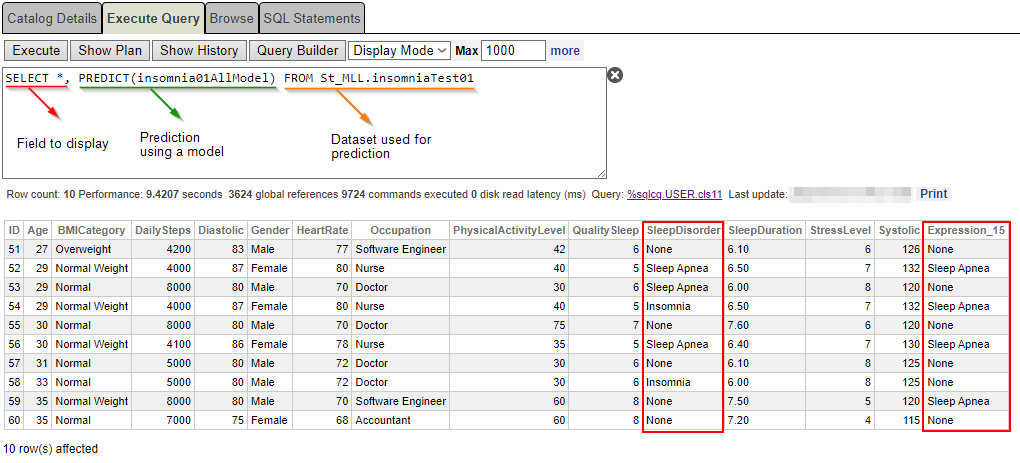 The result looks weird after utilizing 50% of the data exploited to train the model... Why has a 29-year-old female nurse been diagnosed with “insomnia”, whereas the model predicted “sleep apnea”? (see ID 54).
We should examine other models (insomnia01SleepModel and insomnia01BMIModel), created with different columns, but don't worry! I will display the columns used to design them.
SELECT Gender, Age, SleepDuration, QualitySleep, SleepDisorder, PREDICT(insomnia01SleepModel) As SleepDisorderPrediction FROM St_MLL.insomniaTest01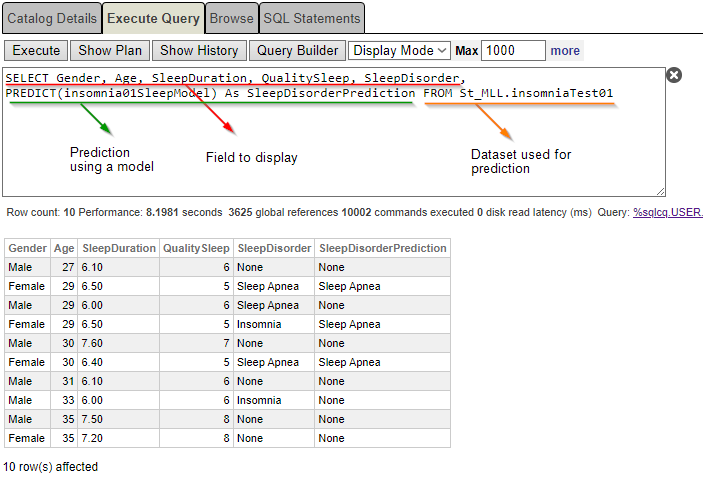
You can see again that a 29-year-old female has been diagnosed with “insomnia”, whereas the prediction states “sleep apnea”.
Ok, you are right! We also need to know what percentage of the prediction has been applied to this final value.
How can we know the percentage of a prediction?
To find out the percentage of the prediction, we should exploit the command “PROBABILITY”.
This command retrieves a value between 0 and 1. However, it is not the probability of prediction, it is the probability to get the value that you wish to check.
This is a good example:
SELECT *, PREDICT(insomnia01AllModel) As SleepDisorderPrediction, PROBABILITY(insomnia01AllModel FOR 'Insomnia') as ProbabilityPrediction FROM St_MLL.insomniaTest01It is the probability of getting “Insomnia” as a sleep disorder.
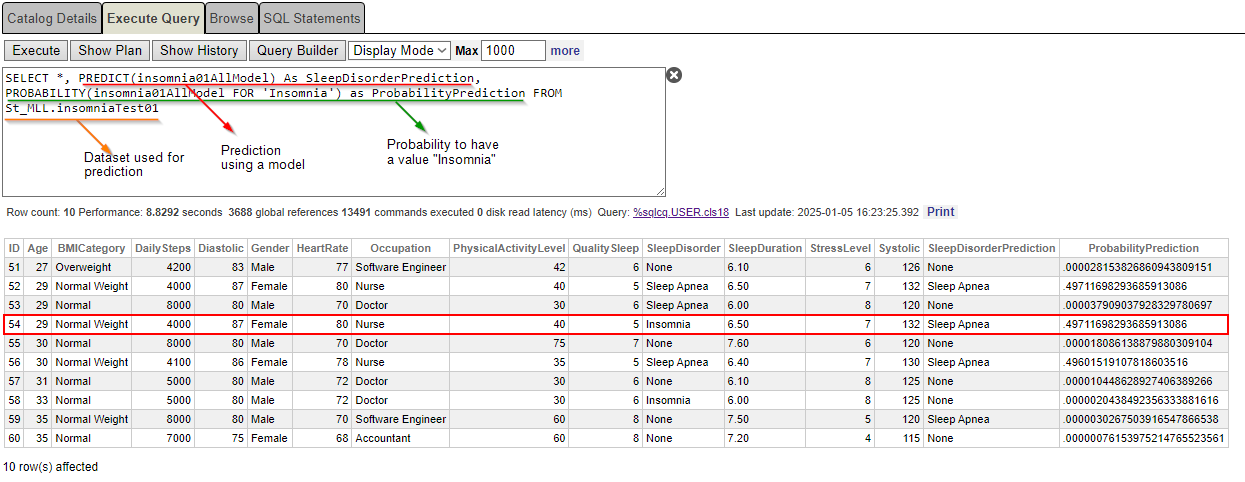 Our nurse, a woman, 29 years old, diagnosed with “Insomnia” has a 49.71% chance of having Insomnia. Still, the prediction is “Sleep Apnea” … Why?
Is the probability the same for other models?
SELECT Gender, Age, SleepDuration, QualitySleep, SleepDisorder, PREDICT(insomnia01SleepModel) As SleepDisorderPrediction, PROBABILITY(insomnia01SleepModel FOR 'Insomnia') as ProbabilityInsomnia,
PROBABILITY(insomnia01SleepModel FOR 'Sleep Apnea') as ProbabilityApnea
FROM St_MLL.insomniaTest01
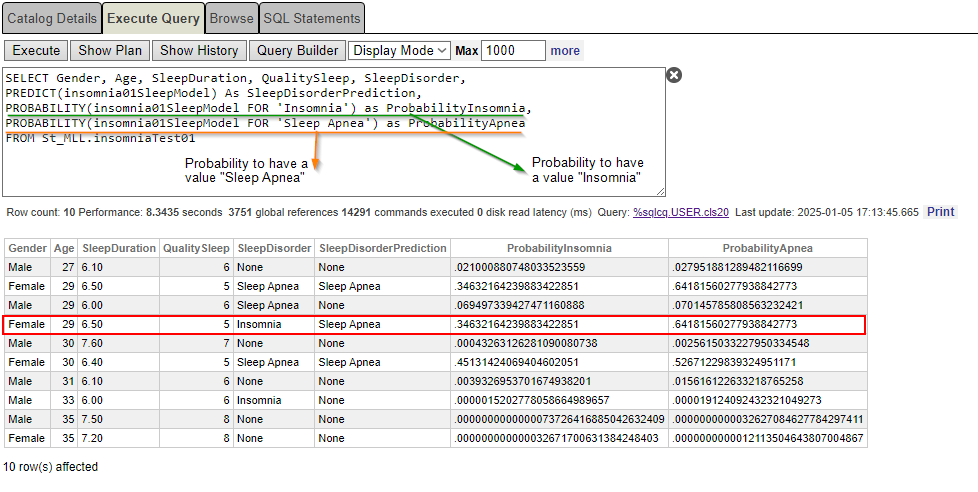
Finally, it is a bit clearer now. According to the data (sex, age, sleep quality, and sleep duration), the probability of having insomnia is only 34.63%, whereas the chance of having sleep apnea is 64.18%.
Wow…It is very interesting! Still, we were exploiting only a small portion of data inserted directly into a table with a class method… How can we upload a huge file with data?
Please, wait for the next article!, it is coming soon.
Comments
Thank you @Kurro Lopez , it is very deep and easy to read. Have you ever had a real use case to use Machine Learning in your daily work? I just ask due to me curiosity.